Notes: Ministry of Finance forecasts represented by larger dots. The other forecasts included are by the Bank of Finland, the European Commission, the IMF, the OECD, Labore, Etla and PTT.
The Economic Policy Council was established in January 2014 to provide independent evaluation of economic policy in Finland. According to the government decree (61/2014), the Council is tasked with evaluating:
The Council is appointed by the government based on a proposal by economics departments of Finnish universities and the Academy of Finland. Council members are appointed for four-year terms and participate in the Council’s work alongside their regular duties.
In our previous report, we assessed the fiscal consolidation package outlined in Prime Minister Petteri Orpo’s government programme, with a particular focus on measures to increase labour supply. In this report, we provide an overview of the implementation of the government’s overall consolidation package and examine the supplementary measures introduced in 2024 as part of our evaluation of the government’s fiscal policy. We also address the financial situation of the wellbeing services counties and discuss certain structural issues related to regional labour markets in Finland.
The Council relies primarily on forecasts from the Ministry of Finance and does not produce its own macroeconomic or fiscal projections. The latest forecast utilised in this report is the Ministry of Finance’s Winter 2024 Economic Survey.
The Council can commission research to support its work. These commissioned studies reflect the views of their authors, which may or may not coincide with those of the Council. Two background reports have been published in connection with this Council report. Cristina Bratu and Teemu Lyytikäinen analysed the urban wage premium in Finland. Veikko Uusitalo, Merja Kauhanen, Annika Nivala and Tuomo Suhonen studied the geographical and occupational mismatch in Finland. We discuss these studies in the last chapter of this report.
The Council organised a seminar on the finances of the wellbeing services counties in November 2024. We thank all the participants in the seminar, and we wish to especially thank Tanja Rantanen, Ilkka Luoma and Tuulia Hakola-Uusitalo for sharing their views on the topic.
The Council expresses its gratitude to the many experts who have shared their insights. We are particularly thankful to Lassi Ahlvik, Ilari Ahola, Marketta Henriksson, Janne Huovari, Jukka Hytönen, Aleksi Kalenius, Jenni Kellokumpu, Peetu Keskinen, Harri Kähkönen, Jussi Lammassaari, Juri Matinheikki, Seppo Orjasniemi, Marja Paavonen, Niina Suutarinen, Roope Uusitalo and Antti Väisänen for valuable discussions and for patiently responding to many detailed questions.
We are also thankful to Anna-Maija Juuso, Tero Järvelä, Mia Klinga, Riikka Könönen, Anne Moilanen, Anita Niskanen, Marjo Nygren, Ida Pöyhönen, Sanna Tiensuu, Sari Virtanen and Outi Örn of VATT for their help in administration and communications.
Helsinki, 28 January 2025
Niku Määttänen, Chair
Seija Ilmakunnas, Vice-Chair
Hilde Bjørnland
Liisa Häikiö
Tuukka Saarimaa
Anni Huhtala, Secretary General, until July 31, 2024
Jenni Jaakkola, Secretary General, since September 1, 2024
Henri Keränen, Researcher
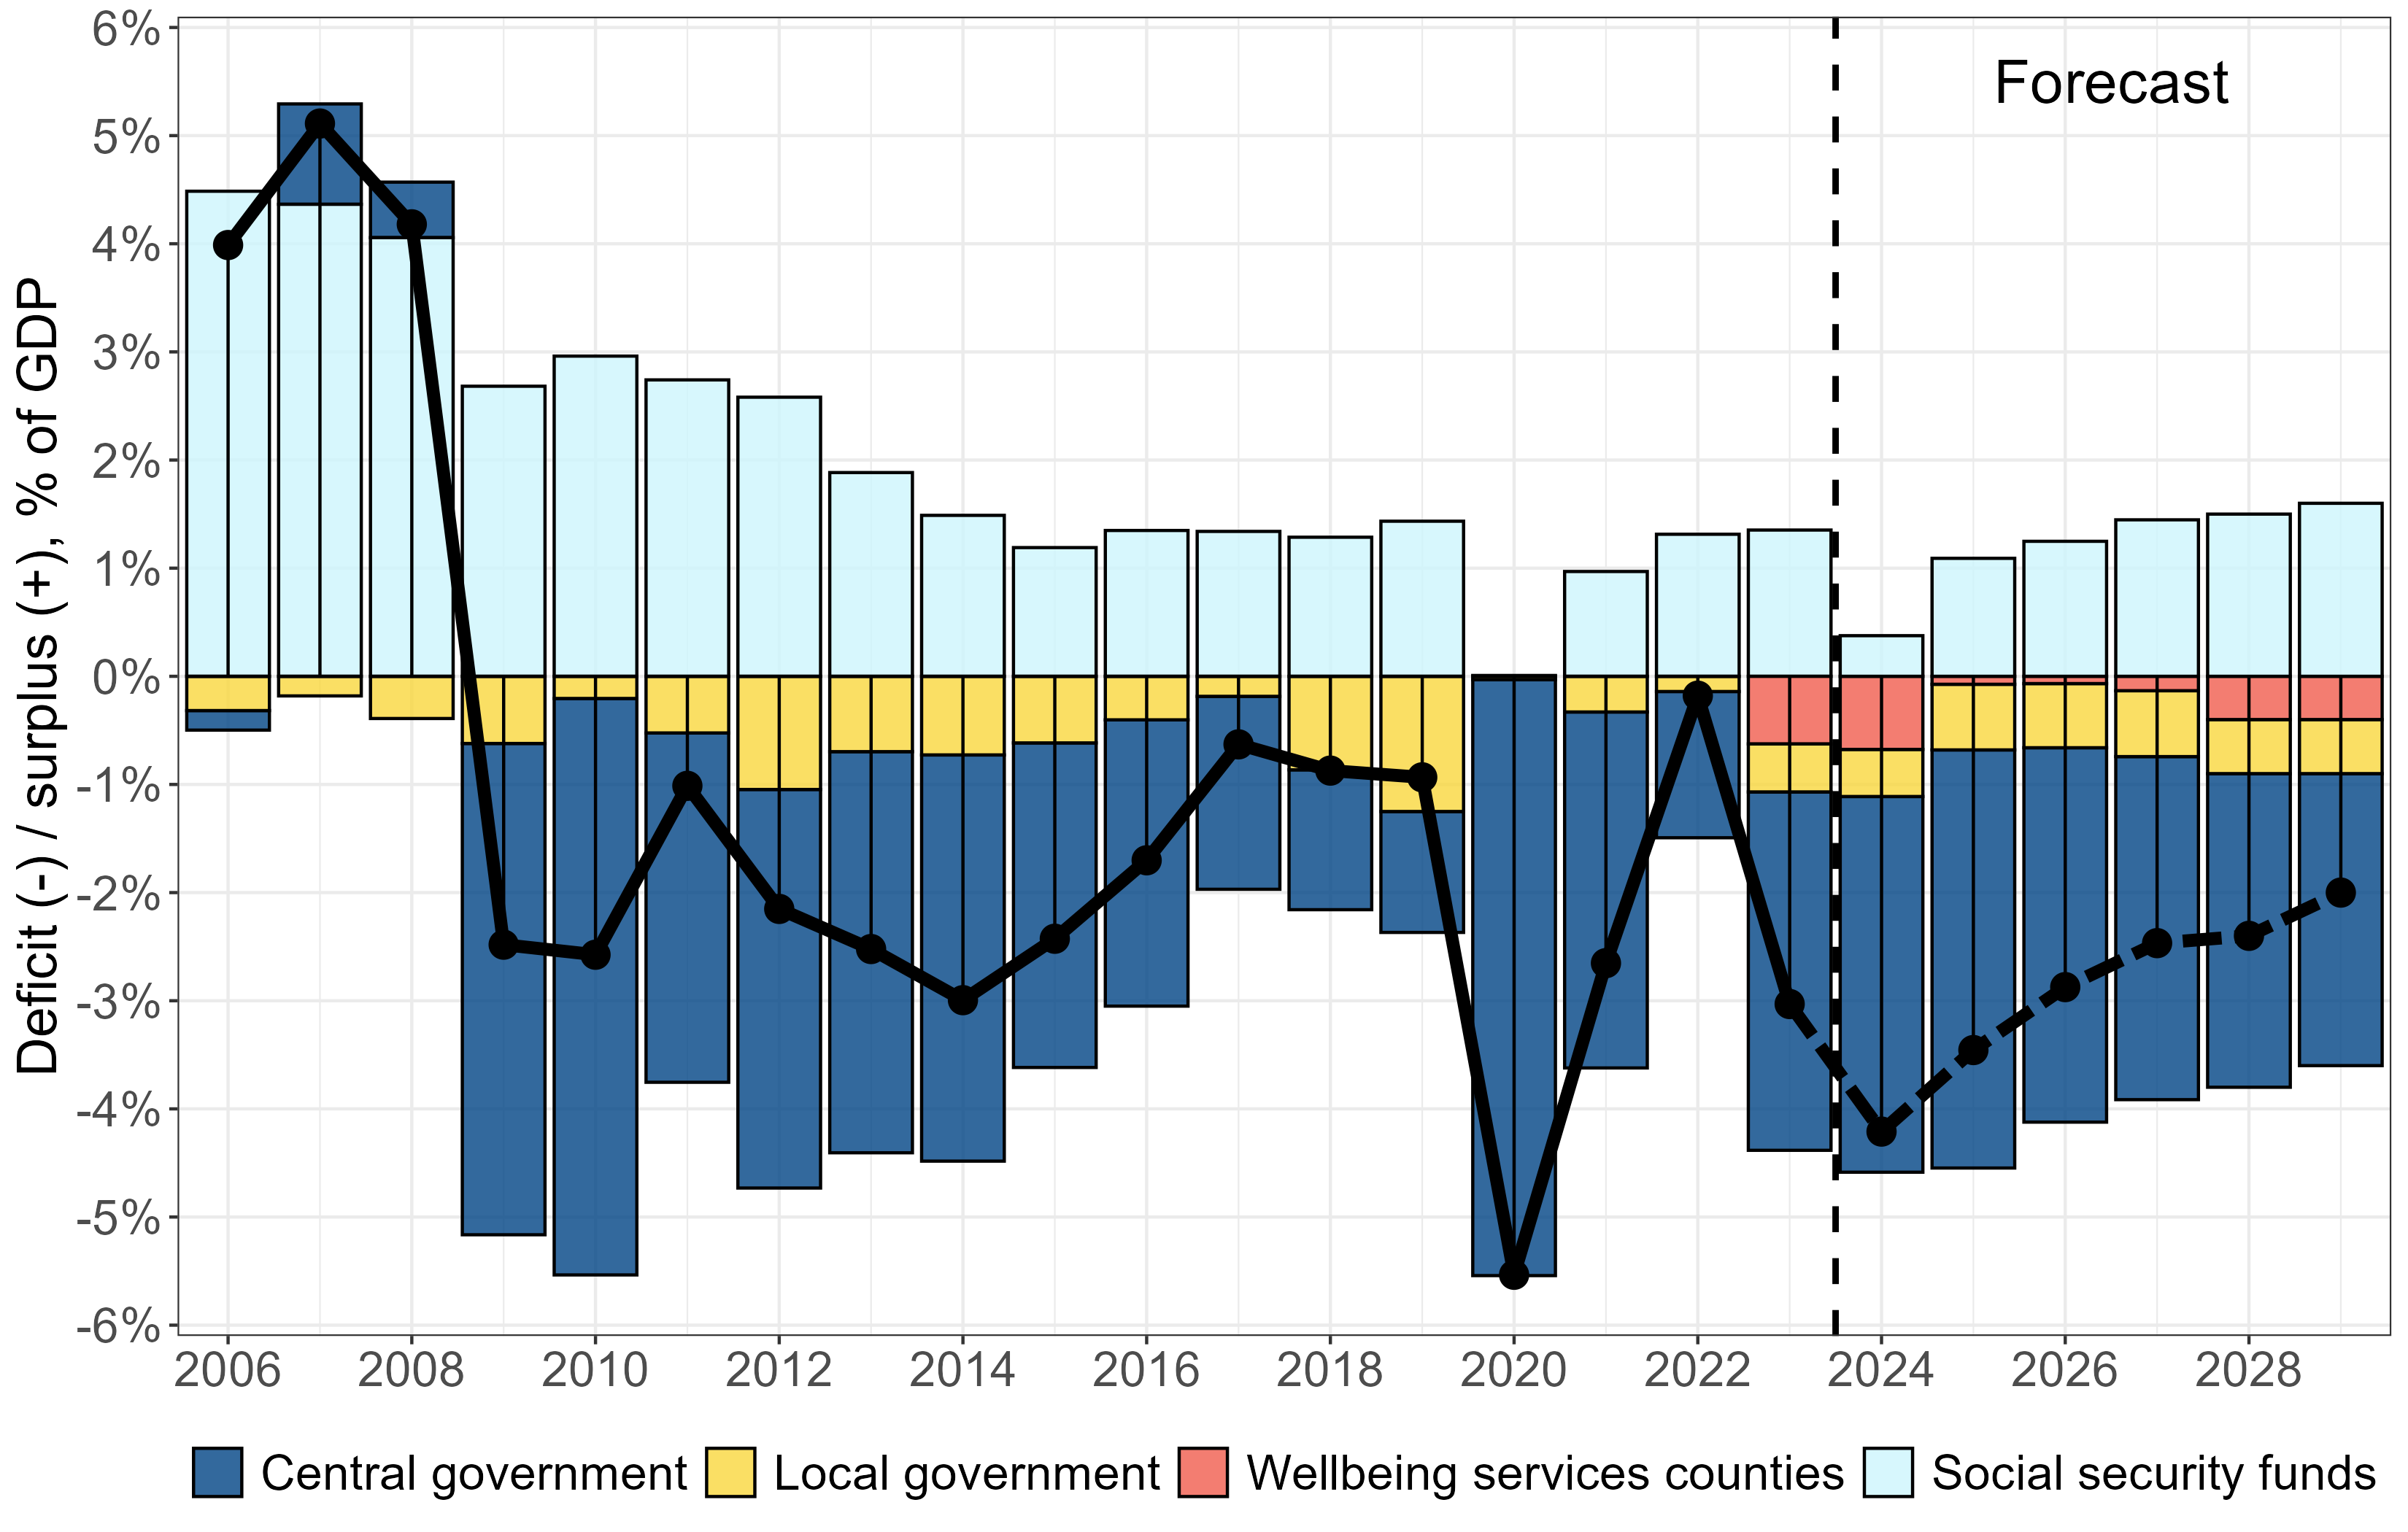
Finland is experiencing a more severe economic downturn than the Nordics and the broader euro area, influenced by factors such as trade sanctions related to the Russian invasion of Ukraine and subsequent disruptions in foreign trade. However, positive growth observed in more recent quarters may indicate the beginning of a stabilisation phase.
Following recent policy rate cuts by the European Central Bank, short-term nominal interest rates in Finland have begun to decline. These lower rates, particularly relevant for most mortgage borrowers, are expected to boost aggregate demand in 2025. In contrast, long-term real interest rates, which are critical for assessing the long-term fiscal cost of public debt, have remained relatively stable following their sharp increase from 2022 to 2023.
Finland has also experienced the largest employment rate decline among its Nordic peers since early 2023. The Ministry of Finance forecasts a slight decrease in the employment rate in the near term, followed by a modest increase as government measures to boost employment gradually take effect.
The first two years of operation were financially challenging for the wellbeing services counties. Their expenditures rose rapidly compared to municipal spending on the same services in 2022, and many counties ran significant deficits.
The spending increases are largely due to factors unrelated to the health and social services reform, such as surging inflation in 2022–2023 and higher wages. Moreover, the counties have had little time to implement productivity-enhancing reforms. For these reasons, the rapid growth in spending and deficits in 2023–2024 should not be seen as evidence of the reform’s failure.
Still, questions remain about whether the current funding model functions optimally. Counties that incurred deficits in their first two years are required to offset these with corresponding surpluses by the end of 2026. This requirement means that many counties should try to reduce their spending significantly in 2025 and 2026. However, if they achieve this, they may find themselves in a position to substantially increase spending in 2027 compared to the preceding years. To safeguard key services, it would be preferable to allow counties to spread expenditure adjustments over a longer period.
The government should consider providing this additional flexibility temporarily. This need not entail an increase in long-term central government funding.
A major challenge for counties is the difficulty and high cost of recruiting qualified staff. The severe scarcity of doctors may be the single most significant obstacle to ensuring adequate healthcare services. The government’s decision to increase reimbursements for the use of private medical services may not alleviate the problem, as it is likely to increase the demand for doctors in the private sector.
Addressing this challenge requires reallocating doctors’ time to tasks where their expertise is most critical. Increasing the supply of doctors is also essential. One option is for counties to fund medical training for students at foreign universities, on the condition that they either work for the counties after graduation or repay their training costs. The government should also review language requirements to attract more migrant doctors. Finland’s growing immigrant population would benefit from access to a wider range of languages, and many Finns could likely communicate effectively with a doctor who does not have perfect command of Finnish or Swedish.
The government has implemented most of the direct savings measures outlined in its programme, including cuts to social benefits and reductions in certain social and health services, either in 2024 or from the beginning of 2025. In addition, it has introduced significant new fiscal measures, such as a 1.5 percentage point increase in the standard VAT rate, a slight tightening of pension income taxation, and further savings in public administration and social and health services. While the VAT increase took effect in September 2024, most other measures will be implemented in 2025. These new measures significantly enhance the credibility of the government’s fiscal policy by underscoring its commitment to strengthening public finances.
Despite the implementation of the government programme and new consolidation measures, the public debt-to-GDP ratio is projected to grow relatively quickly in 2025. Furthermore, it remains uncertain whether the measures taken so far will suffice to achieve the government’s primary fiscal objective of stabilising the debt ratio by the end of its term. One contributing factor is the weakening of the business cycle since the start of the government’s term.
Another reason is that some consolidation measures were uncertain from the outset. For example, the government programme assumed that labour supply measures would strengthen public finances by approximately EUR 2 billion annually through higher employment. These measures aim to improve labour supply incentives by reducing transfers for those not working. However, their impact is difficult to estimate and will in any case take time to fully materialise. The weakened economic situation is likely to have further delayed their employment effects. A third reason is the rapid growth in spending by the wellbeing services counties.
The government’s consolidation measures significantly tighten fiscal policy in 2025 compared to 2024. The recent rise in unemployment and Finland’s lower inflation compared to the rest of the euro area suggest that the timing of these measures is not ideal from the perspective of stabilising aggregate demand. On the other hand, employment remains relatively high compared to pre-COVID-19 levels, the output gap is expected to improve in 2025, and public spending continues to rise even without new policy decisions due to population ageing. Additionally, as mentioned above, the recent easing of euro area monetary policy should begin to support aggregate demand in 2025. Given these conditions and the risks of a rising debt ratio, the government’s fiscal stance in 2025 does not appear overly restrictive. However, unless the business cycle improves rapidly, it would be prudent to avoid further measures that substantially reduce aggregate demand in the very short term.
Regardless of the economic cycle, the government should pursue reforms to strengthen public finances in the long run. The pension reform mentioned in the government programme represents a key opportunity in this regard.
Stronger measures are also needed in climate policy to reduce emissions in the effort-sharing sector and enhance carbon sinks in the land-use sector. Missing these targets undermines Finland’s climate credibility and heightens the fiscal risks. From a public finance perspective, greater reliance on taxes and fees related to emissions or carbon sink reductions, rather than subsidies and grants, would be preferable.
Due to agglomeration effects, labour productivity can probably be improved by increasing the size of the largest cities. Cities can only grow in population if they increase the supply of housing and commercial real estate. This underlines the importance of policies aimed at increasing the supply of housing in cities with the highest housing costs. Continuing the government’s cooperation with municipalities through land use, housing and transport (MAL) agreements is likely to be essential in this regard.
However, the concentration of population in cities can have negative effects on other parts of Finland. Labour migration from abroad can support productivity growth by facilitating the expansion of labour markets around the largest cities, without necessarily causing population decline elsewhere.
The Finnish labour market seems to have become less efficient in matching unemployed jobseekers with vacancies in recent decades. This trend does not seem to be due to an increase in regional or occupational mismatches between jobseekers and vacancies. Regional mismatch refers to the geographical distance between jobseekers and vacancies, while occupational mismatch refers to a mismatch between jobseekers’ skills and the requirements of available jobs. Urbanisation has likely improved employment by allowing unemployed jobseekers to find vacancies matching their skills and education more quickly.
Public employment services have been transferred from central government to the municipalities. While this decentralisation alone is unlikely to have a strong direct impact on employment, the reform includes changes in incentives that could strengthen employment outcomes. For example, municipalities now bear an increasing share of the costs of unemployment benefits paid to their residents, and these costs increase with the duration of unemployment. This should motivate municipalities to adopt more effective policies to improve employment in the local labour market.
However, there are risks associated with the reform. Removing barriers to employment often requires close cooperation between employment and health service providers. Under the new system, the municipalities are responsible for employment services, while the wellbeing services counties are responsible for health services. This division of responsibilities may lead to cost-shifting that harms those most in need of measures to support their ability to work. It will be important to monitor how municipalities and wellbeing counties address these challenges.
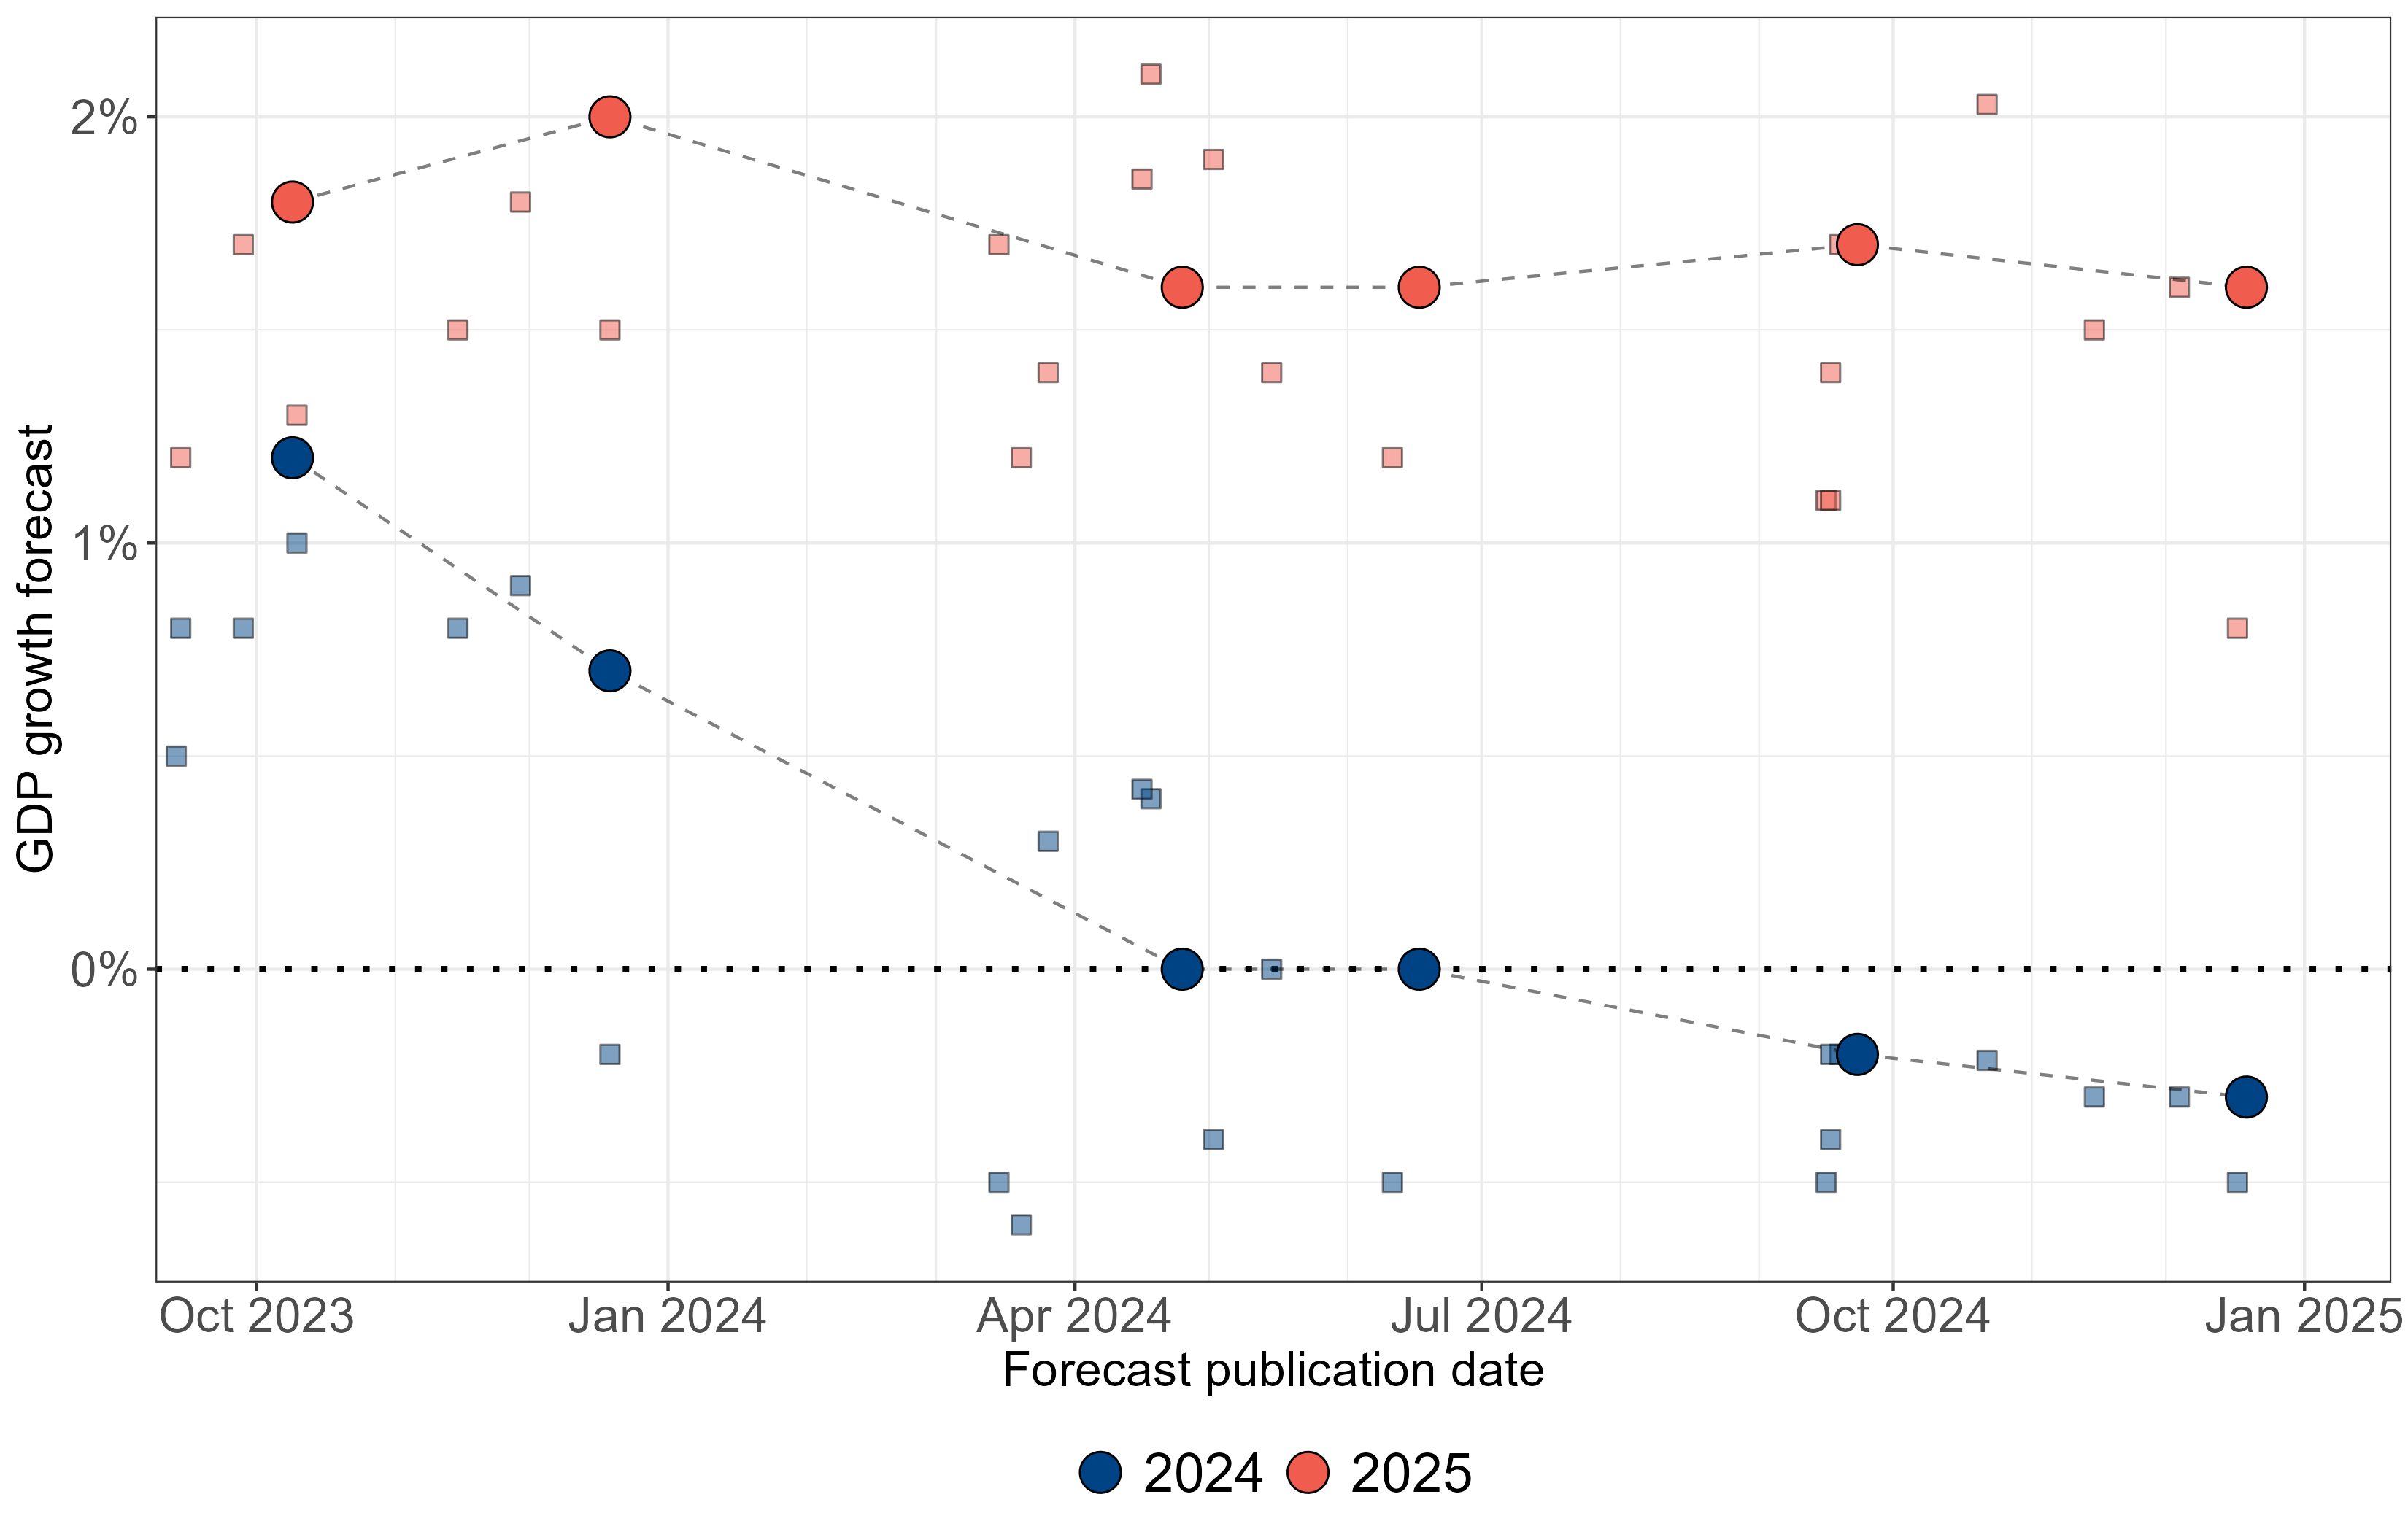
Since the Council’s previous report, Finland’s economic outlook has worsened. Figure 2.1.1, which plots GDP growth forecasts for Finland made since September 2023, shows how the growth forecasts for 2024 have been revised downwards since then. For instance, in the forecast made in autumn 2023, the Ministry of Finance forecast growth of for 2024, while the most recent forecast in December 2024 puts growth for 2024 at . Similarly, other forecasting institutions have revised their GDP forecasts downwards as more recent economic data has shown that the economic growth projected for 2024 has not materialised. The only forecast in 2023 to predict negative growth for 2024 was published by the Bank of Finland in December 2023.
Notes: Ministry of Finance forecasts represented by larger dots. The other forecasts included are by the Bank of Finland, the European Commission, the IMF, the OECD, Labore, Etla and PTT.
Even though the annual growth rate in 2024 is forecast to be negative, a look at quarterly GDP reveals that by the end of 2024 aggregate output started to grow (Figure 2.1.2). Figure 2.1.1 also shows that there have been no systematic downward revisions to growth forecasts for 2025. The most recent Ministry of Finance (2024b) forecast puts growth at . Among the forecasting institutions included in Figure 2.1.1, Bank of Finland (2024) forecast published in December 2024 had the lowest GDP growth forecast for 2025 at .
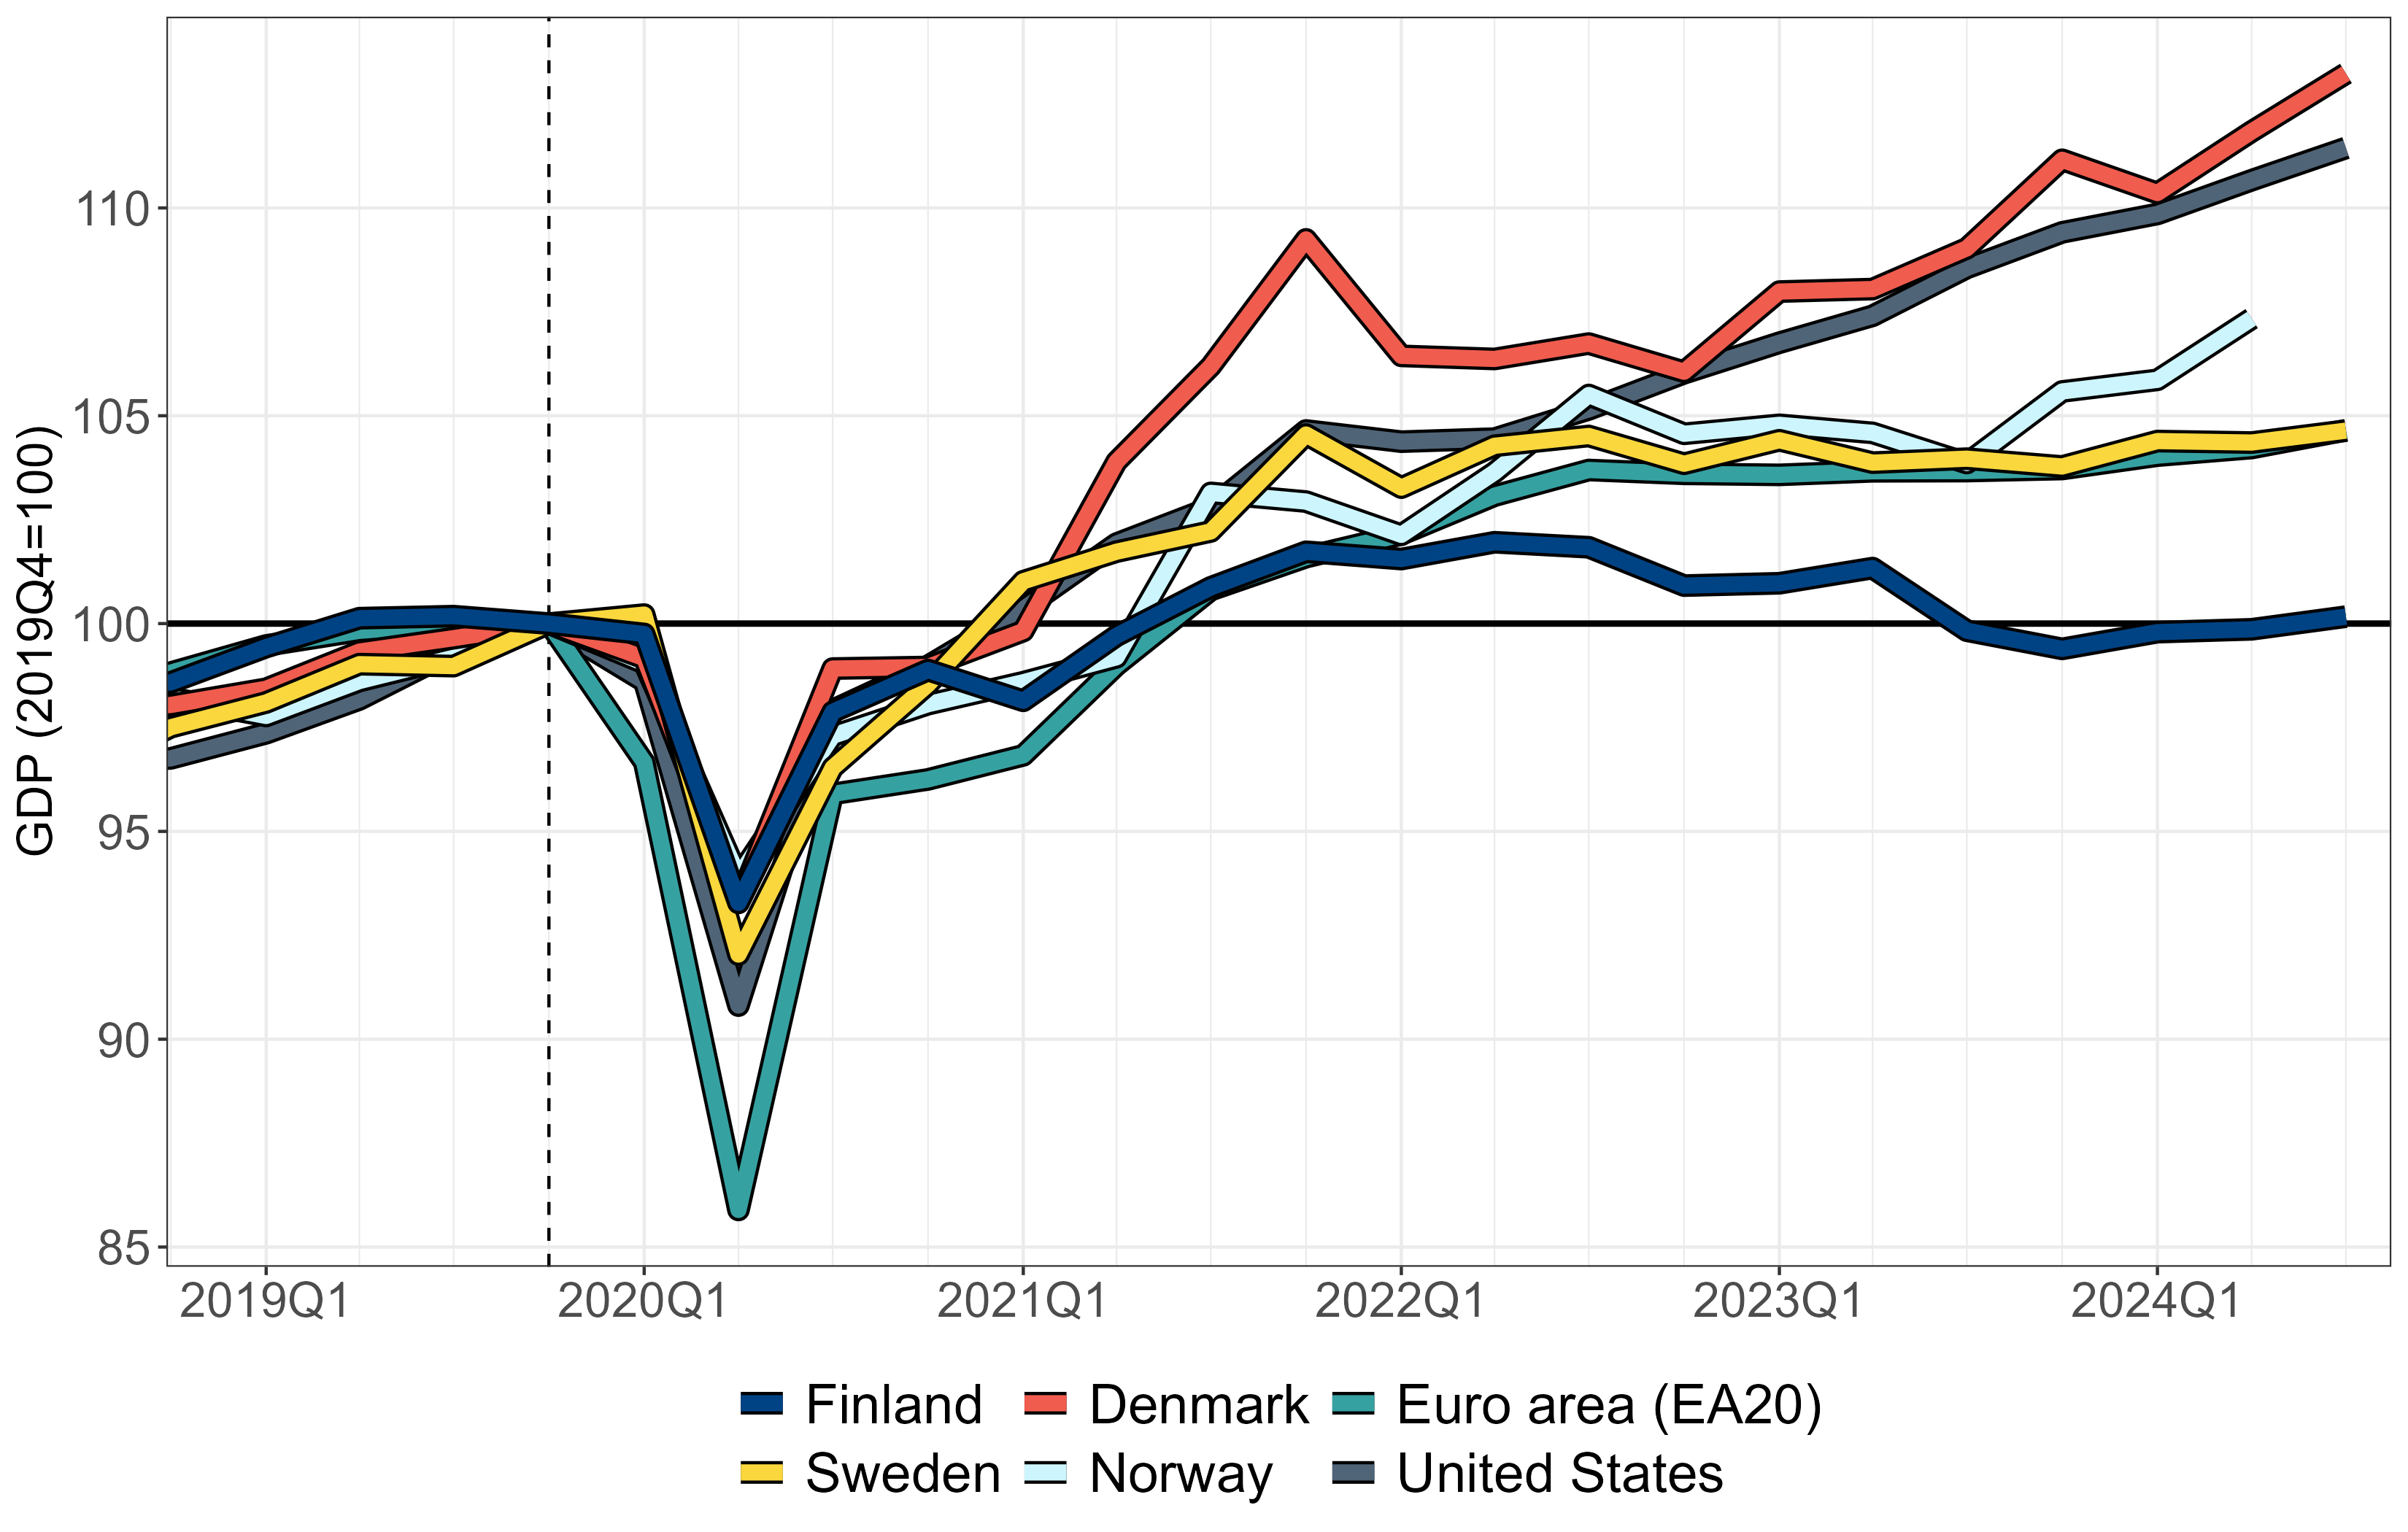
Figure 2.1.2, which tracks quarterly real GDP developments in selected countries since the last quarter of 2019, shows that Finland’s output growth continues to lag behind both its Nordic peers and the euro area average. Growth in Finland turned negative in 2022 following Russia’s invasion of Ukraine. It is plausible that the Finnish economy has suffered the most from the effects of the conflict, including trade sanctions against Russia, among this group of countries. Growth in Sweden and the euro area has also stagnated, which further negatively impacts the Finnish economy through foreign trade. In contrast, growth in the US and Denmark has been relatively strong, with Denmark benefiting from the recent success of the pharmaceutical company Novo Nordisk.
Sources: Eurostat and FRED.
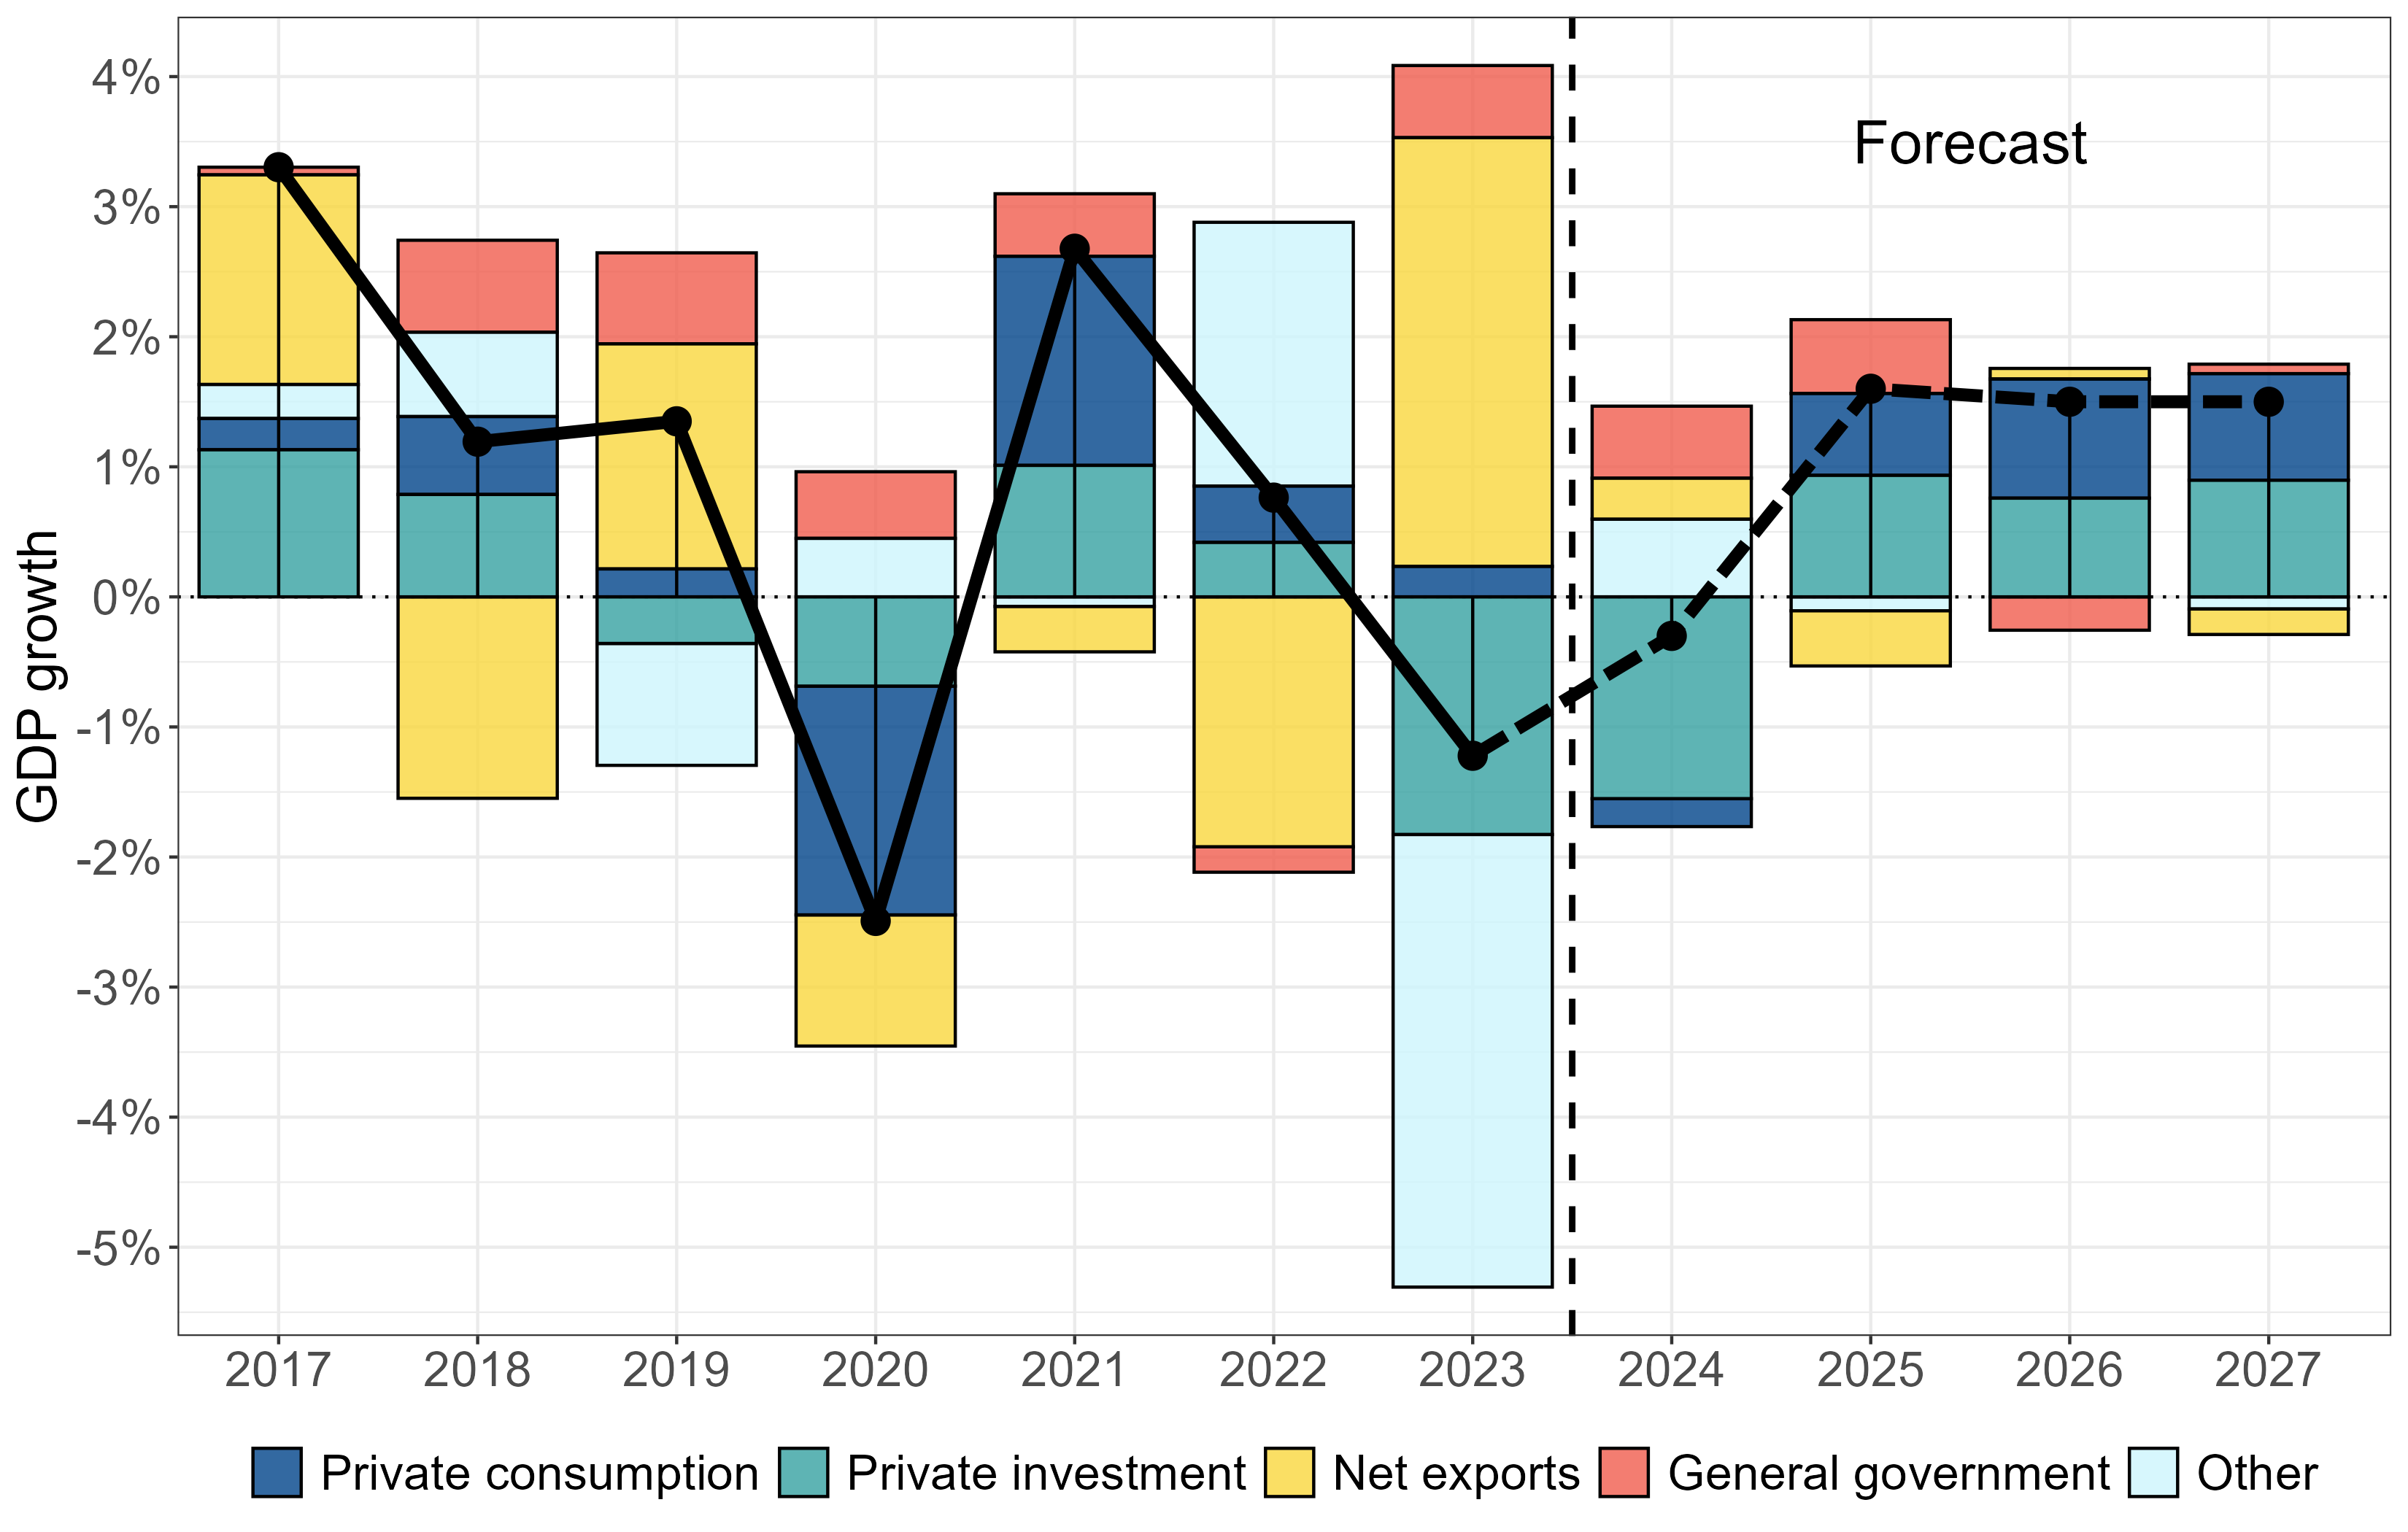
Figure 2.1.3 decomposes the annual growth in Finnish GDP into its main expenditure components. Private investment is typically a highly pro-cyclical component of GDP, rising in upturns and falling in downturns. The figure shows that this has also been the case in the most recent downturn: private investments fell sharply in 2023 (by about ), contributing negatively to aggregate growth (with a growth contribution of about as private investments are around a fifth of total GDP). The construction sector, in particular, experienced a severe contraction in 2023 and in 2024. This decline largely explains the overall fall in investment expenditure as construction constitutes a large share of total investment in the Finnish economy. According to the Ministry of Finance (2024b) forecast, private investments continued to decline in 2024 but are expected to return to growth in 2025.
Sources: Statistics Finland, Ministry of Finance (2024b) and Council’s calculations. Notes: The category Other consists of all other components contributing to GDP: changes in inventories, net acquisitions of valuables and statistical discrepancy.
In a small open economy like Finland, changes in net exports can also make a large contribution to aggregate output. In 2023, net exports made a large positive contribution to GDP, while aggregate growth was negative. However, this positive contribution was almost entirely due to a fall in imports, as export growth was close to zero in 2023. According to the Ministry of Finance (2024b) forecast, net exports are expected to have a small positive contribution to GDP in 2024, with imports still falling slightly and with growth in exports being small but positive. In 2025 both exports and imports are forecast to grow, but import growth is projected to be higher than export growth, meaning that in total the contribution of net exports to GDP growth is forecast to be slightly negative.
Figure 2.1.3 shows that growth in 2025-2027 is forecast to come mainly from increases in private consumption and private investment. In 2025, general government is also forecast to make a positive contribution, although the growth will come mainly from public investment, as the volume of government consumption is forecast to decline slightly in 2025 (Ministry of Finance, 2024b). The increase in public investment largely reflects deliveries of new military equipment (see chapter 4 on fiscal policy).
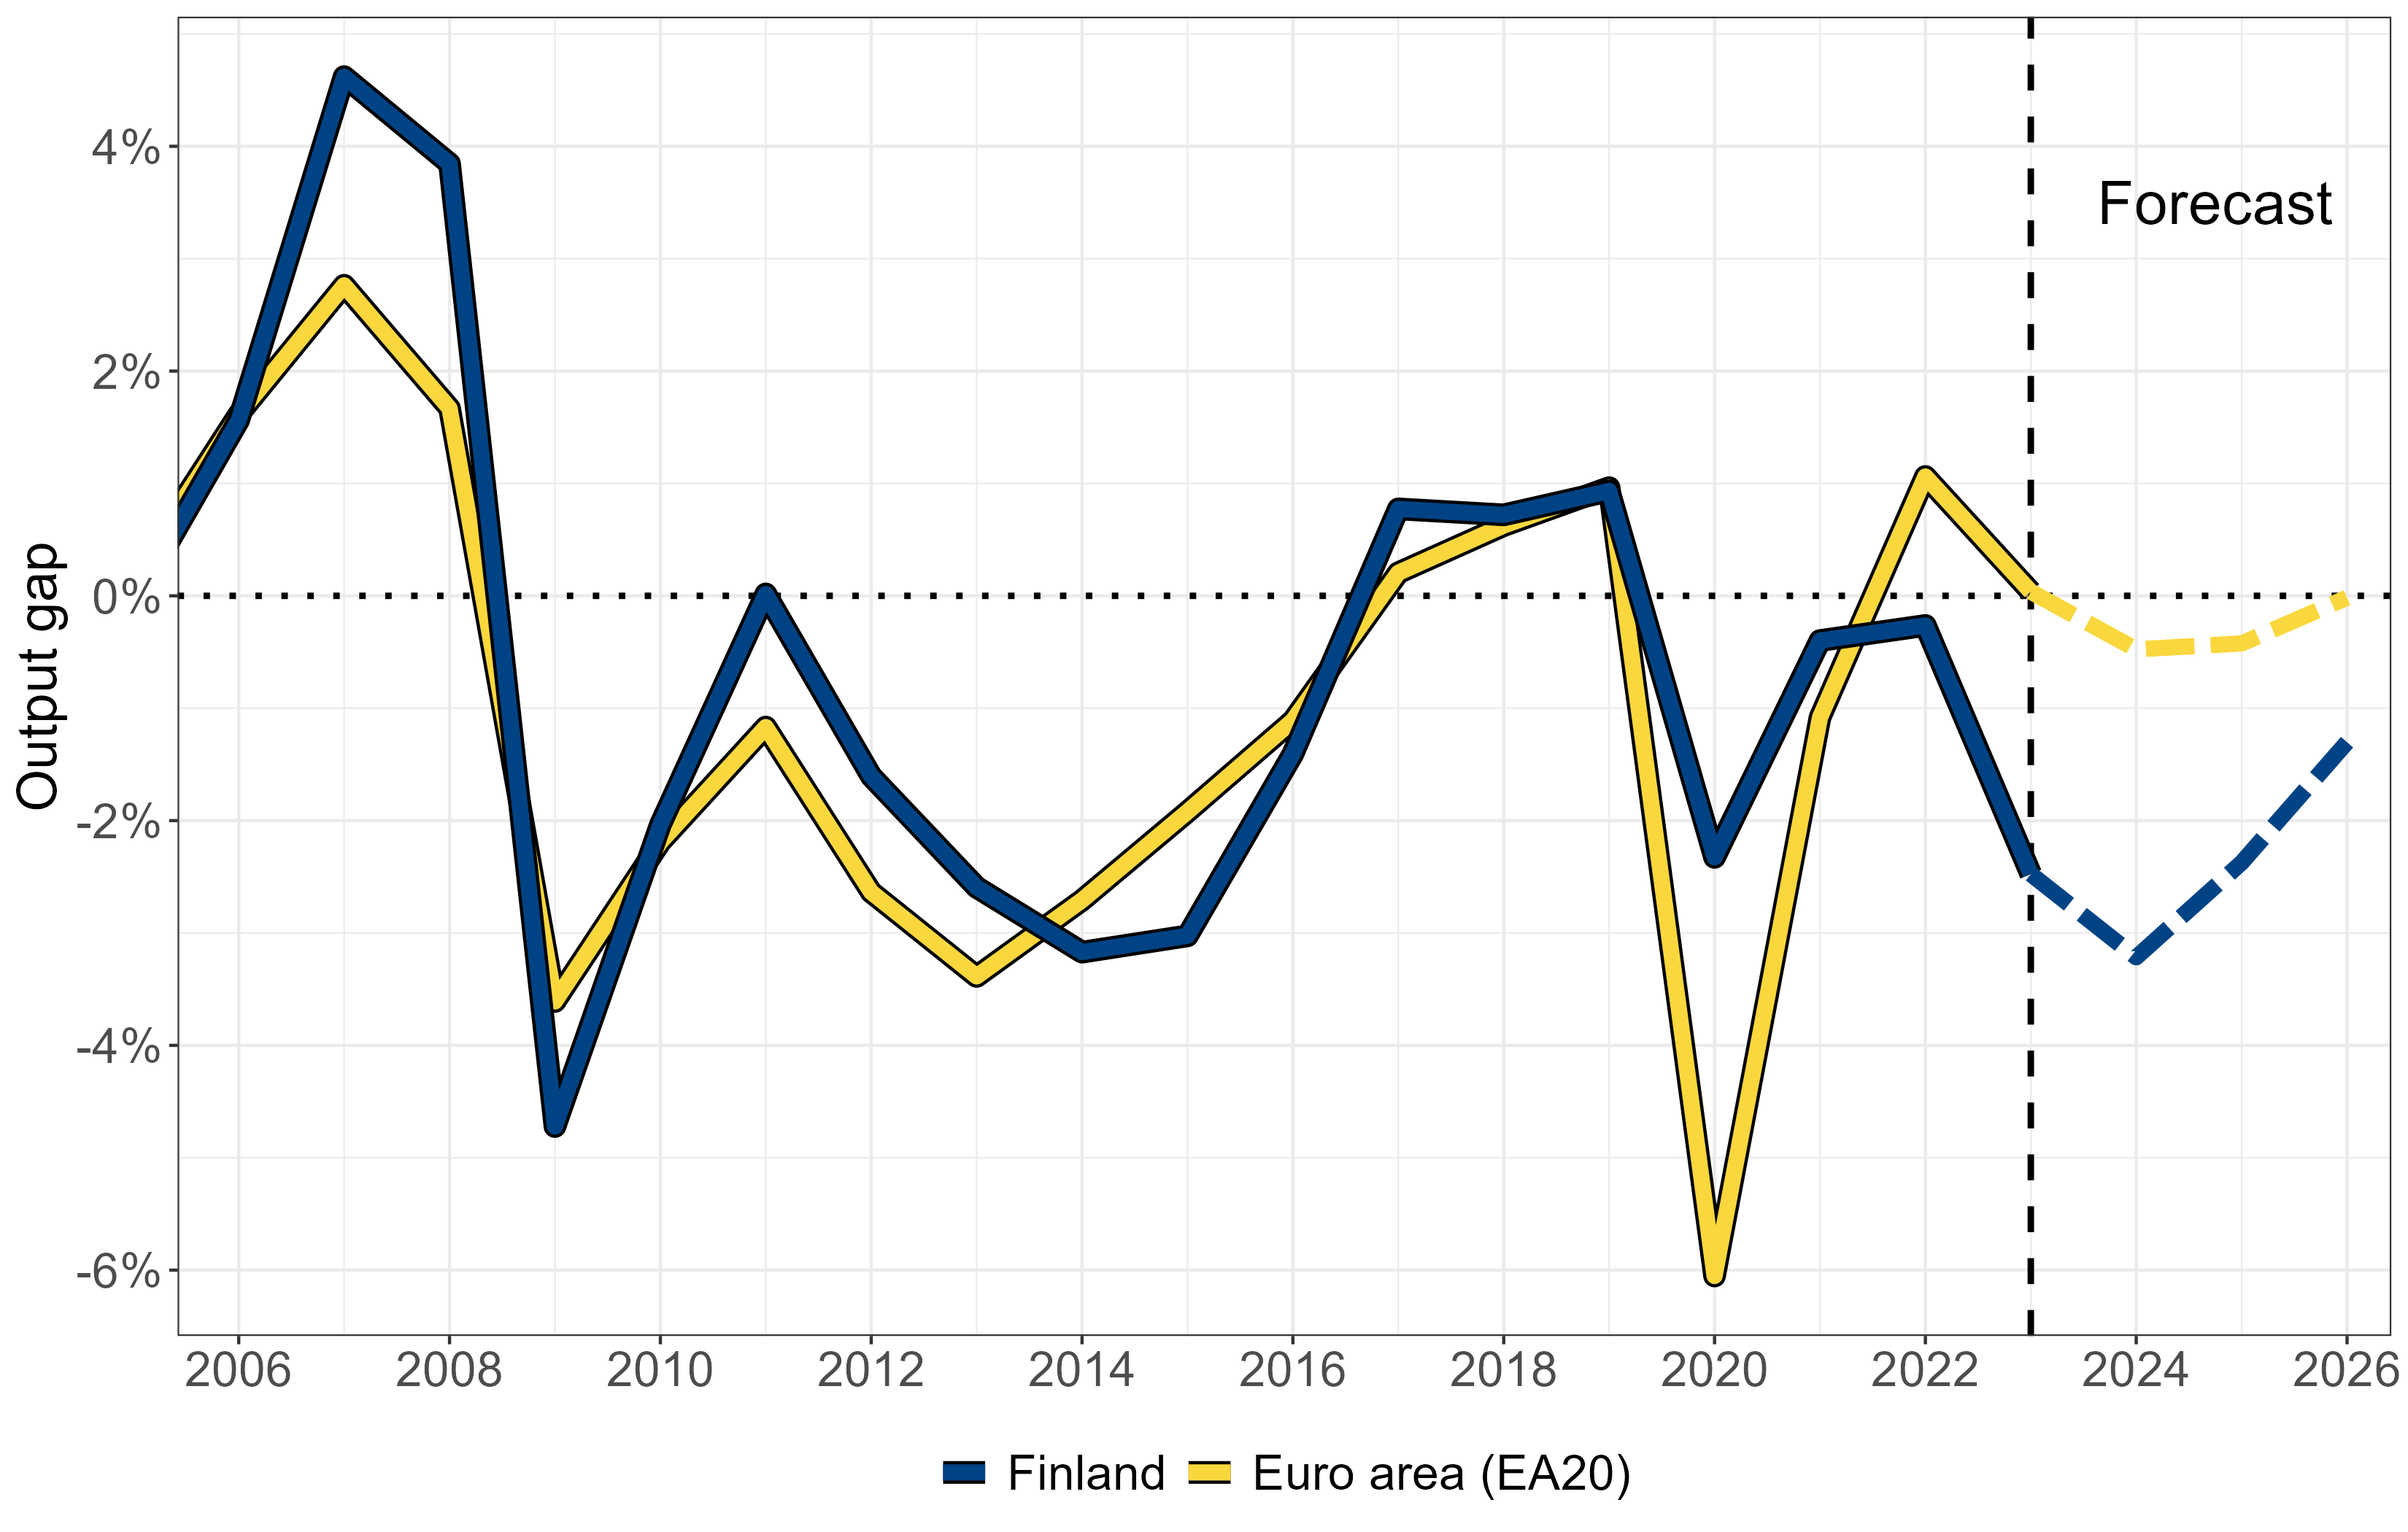
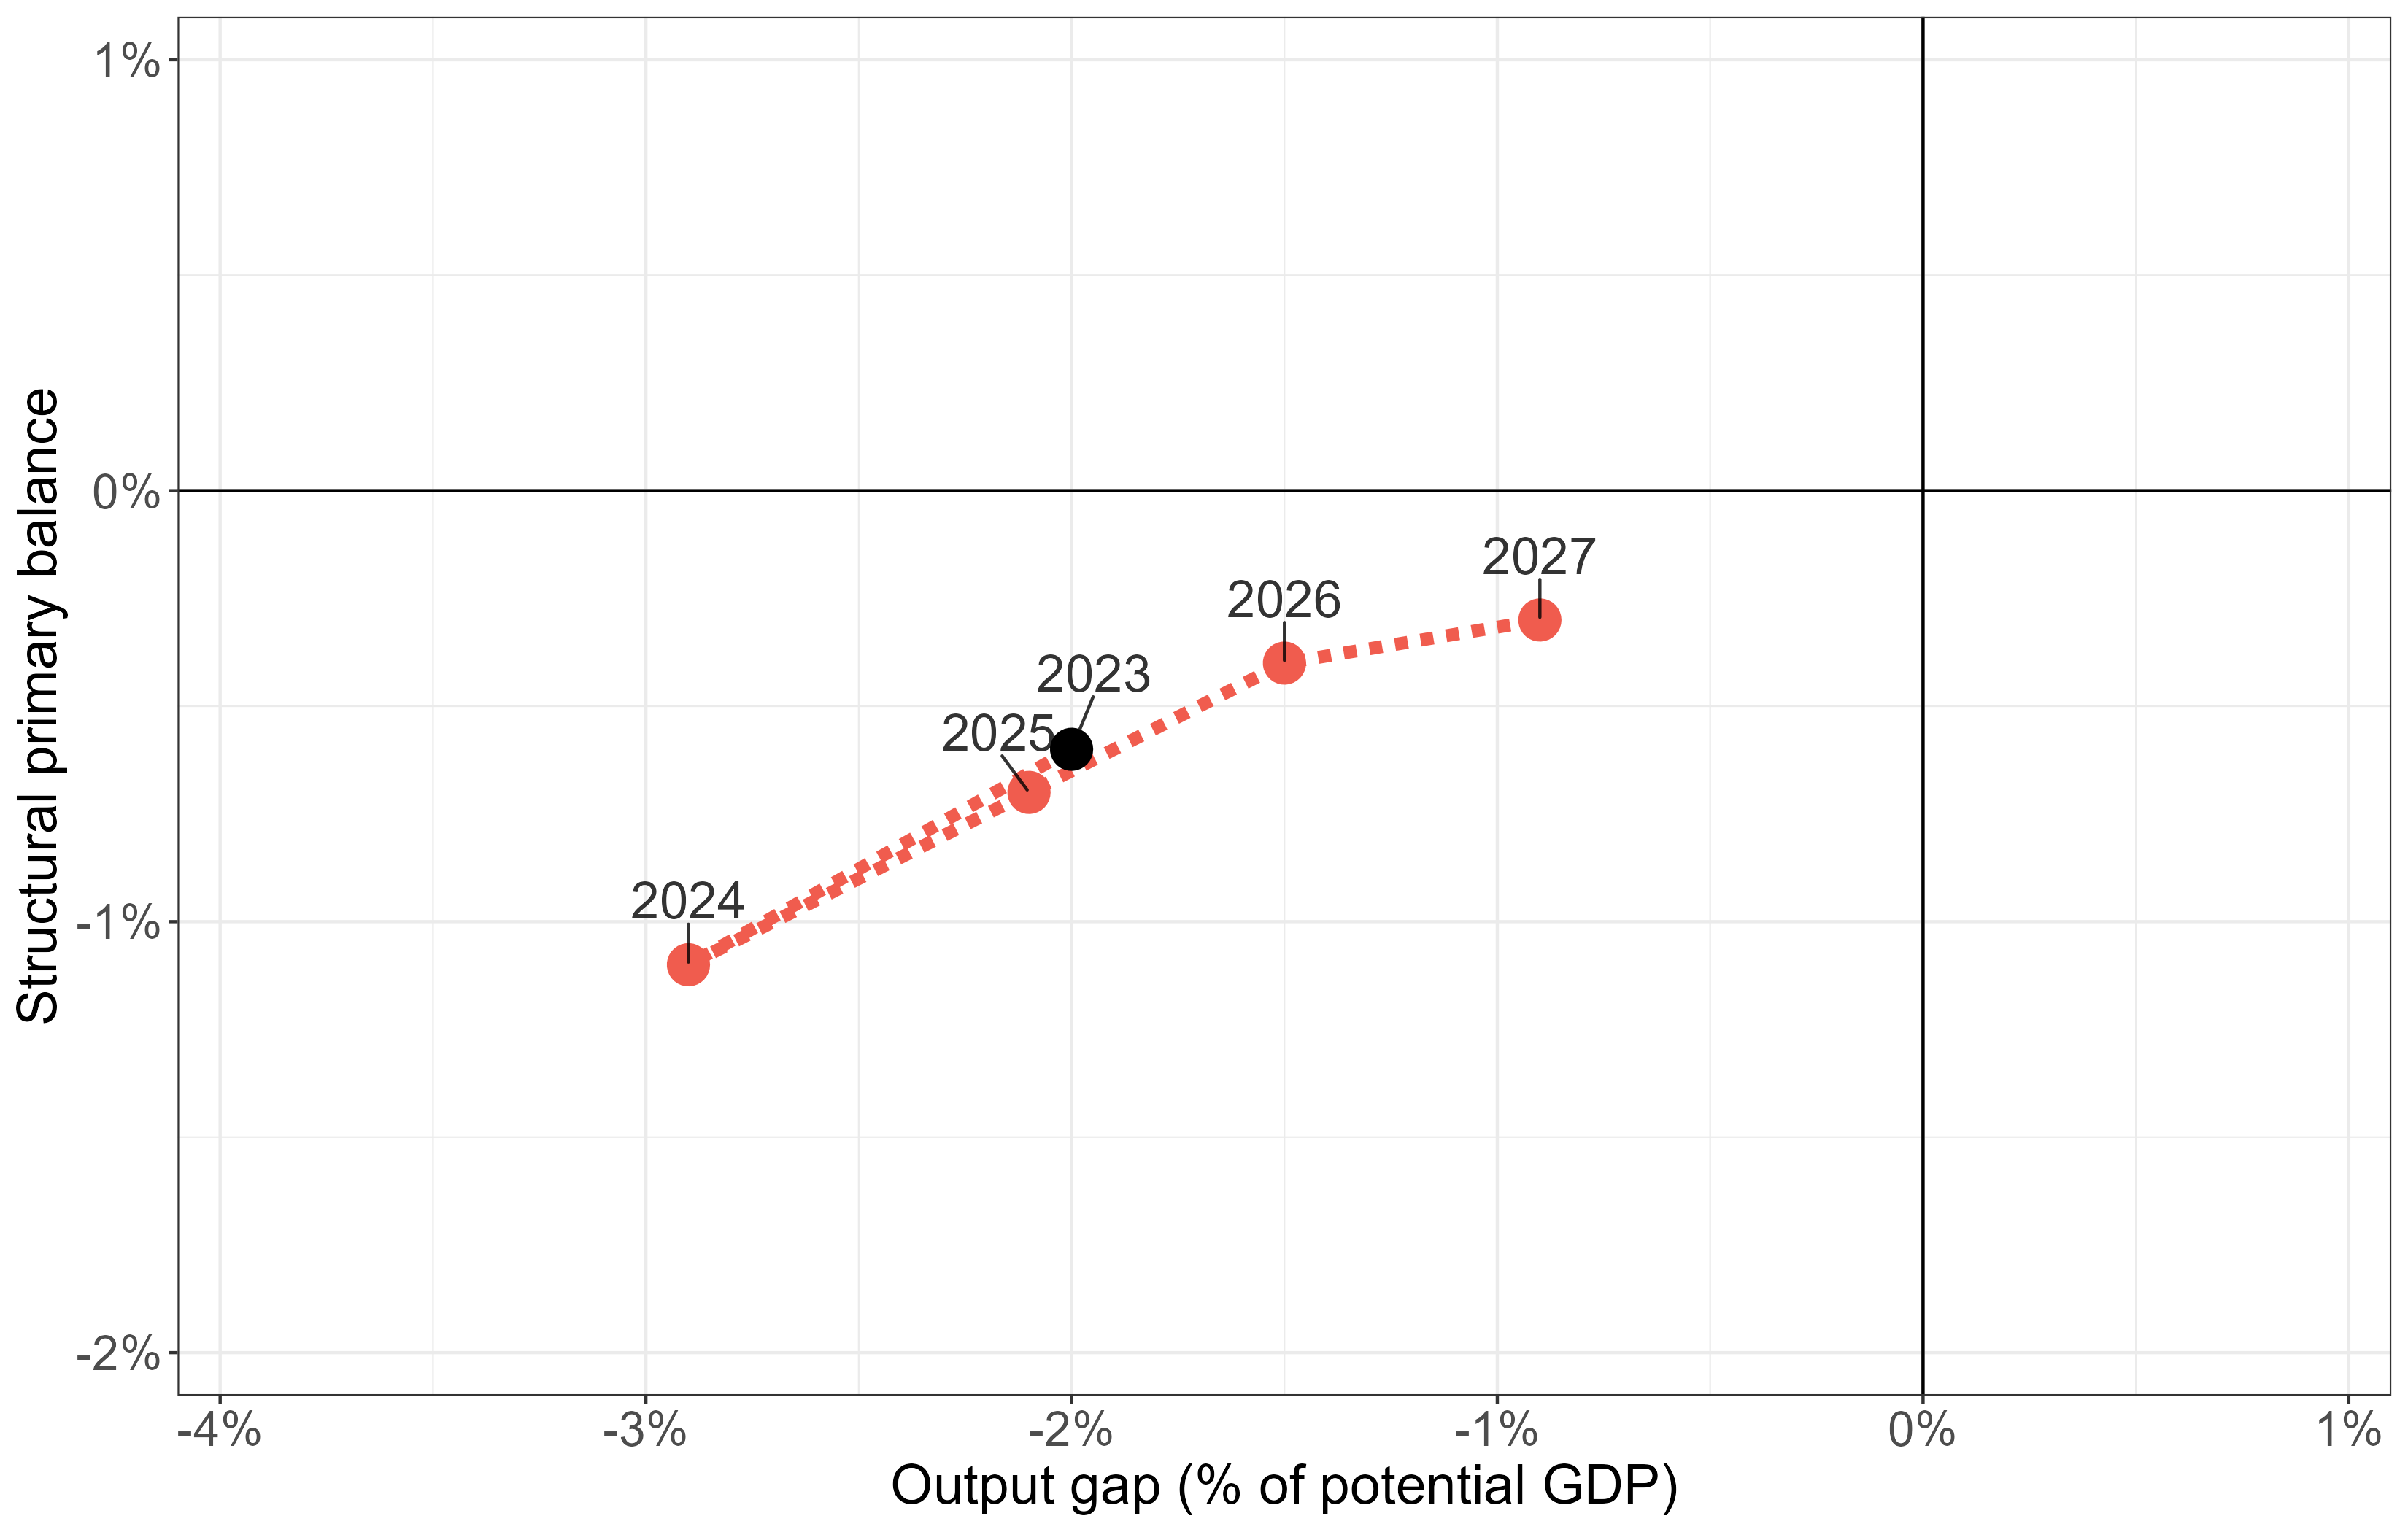
A typical measure of the cyclical position of the economy is the output gap: the difference between actual and potential GDP. Figure 2.1.4 plots the output gap for Finland and the euro area based on estimates by the European Commission. According to the Commission’s Autumn 2024 forecast, Finland’s output gap is around , compared to approximately for the euro area. This suggests that Finland is experiencing a more significant cyclical downturn than the euro area economy on average. However, Finland’s output gap is also forecast to shrink rather quickly in 2025 and 2026. At the same time, it is important to note that real-time estimates of the output gap are known to be prone to large ex-post revisions (see e.g. Rybarczyk, 2023).
Source: European Commission (AMECO database).
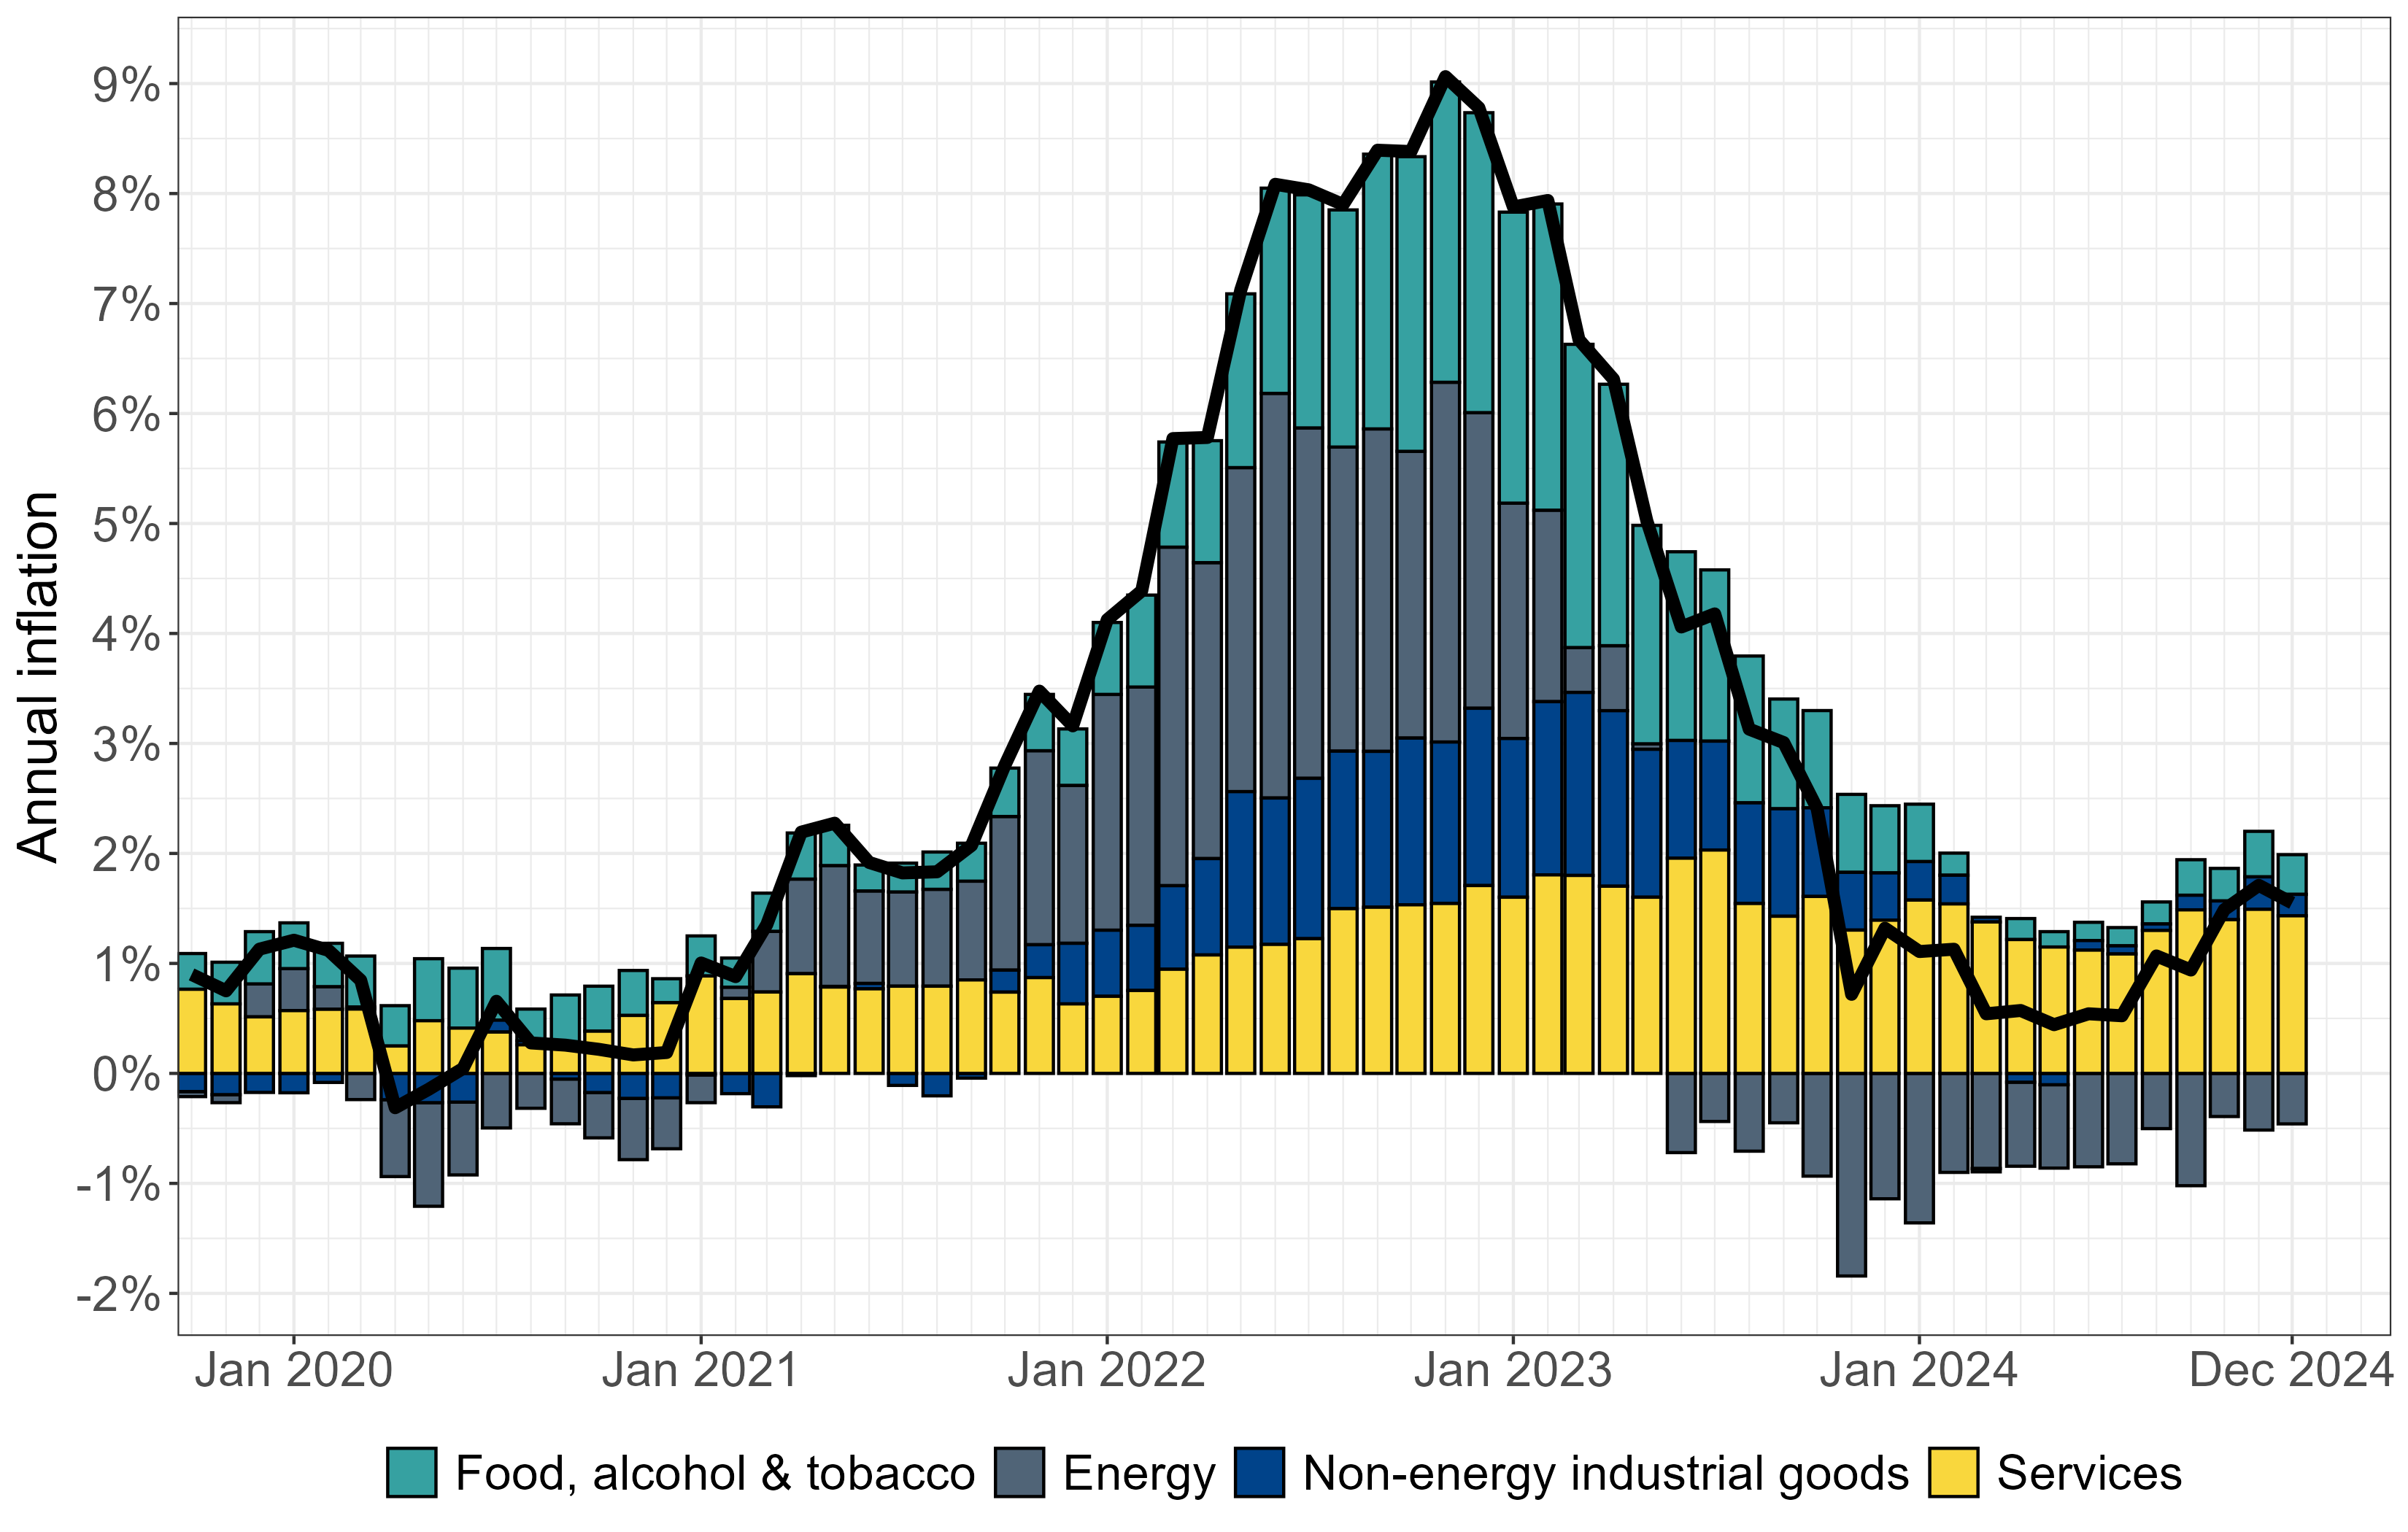
Inflation continued to decline in 2024 from the elevated levels observed in 2022 and early 2023, as shown in Figure 2.2.1. Annual HICP (Harmonised Index of Consumer Prices) inflation was on average roughly in 2024. Service inflation has been the main contributor to annual inflation, while the decline in energy prices has had a negative contribution. Inflation in Finland has recently been lower than in the euro area, where according to Eurostat data the average for 2024 was around .
The most recent data indicates a slight uptick in inflation compared to previous months. This increase is partly attributable to the VAT hike implemented in September 2024, as well as a correction to the HICP index following an error in the price index of electricity, which affected annual inflation figures between August 2023 and July 2024. The Ministry of Finance (2024b) forecasts HICP inflation to be in 2025.
Source: Statistics Finland.
Falling inflation has allowed central banks to lower their policy rates. The ECB began reducing its key policy rates in June 2024, cutting the overnight deposit rate from to by December 2024. Euribor rates, to which the majority of Finnish mortgages are tied, have also declined throughout 2024. The decrease in Euribor rates also reflects expectations of further cuts in the ECB’s policy rates in the near future.
A decline in short-term nominal interest rates, coupled with relatively stable inflation, is likely to result in a lower real interest rate, the rate of interest net of inflation, in 2025 compared to 2024. This can be expected to boost aggregate demand in 2025, particularly compared to the situation in early 2024.
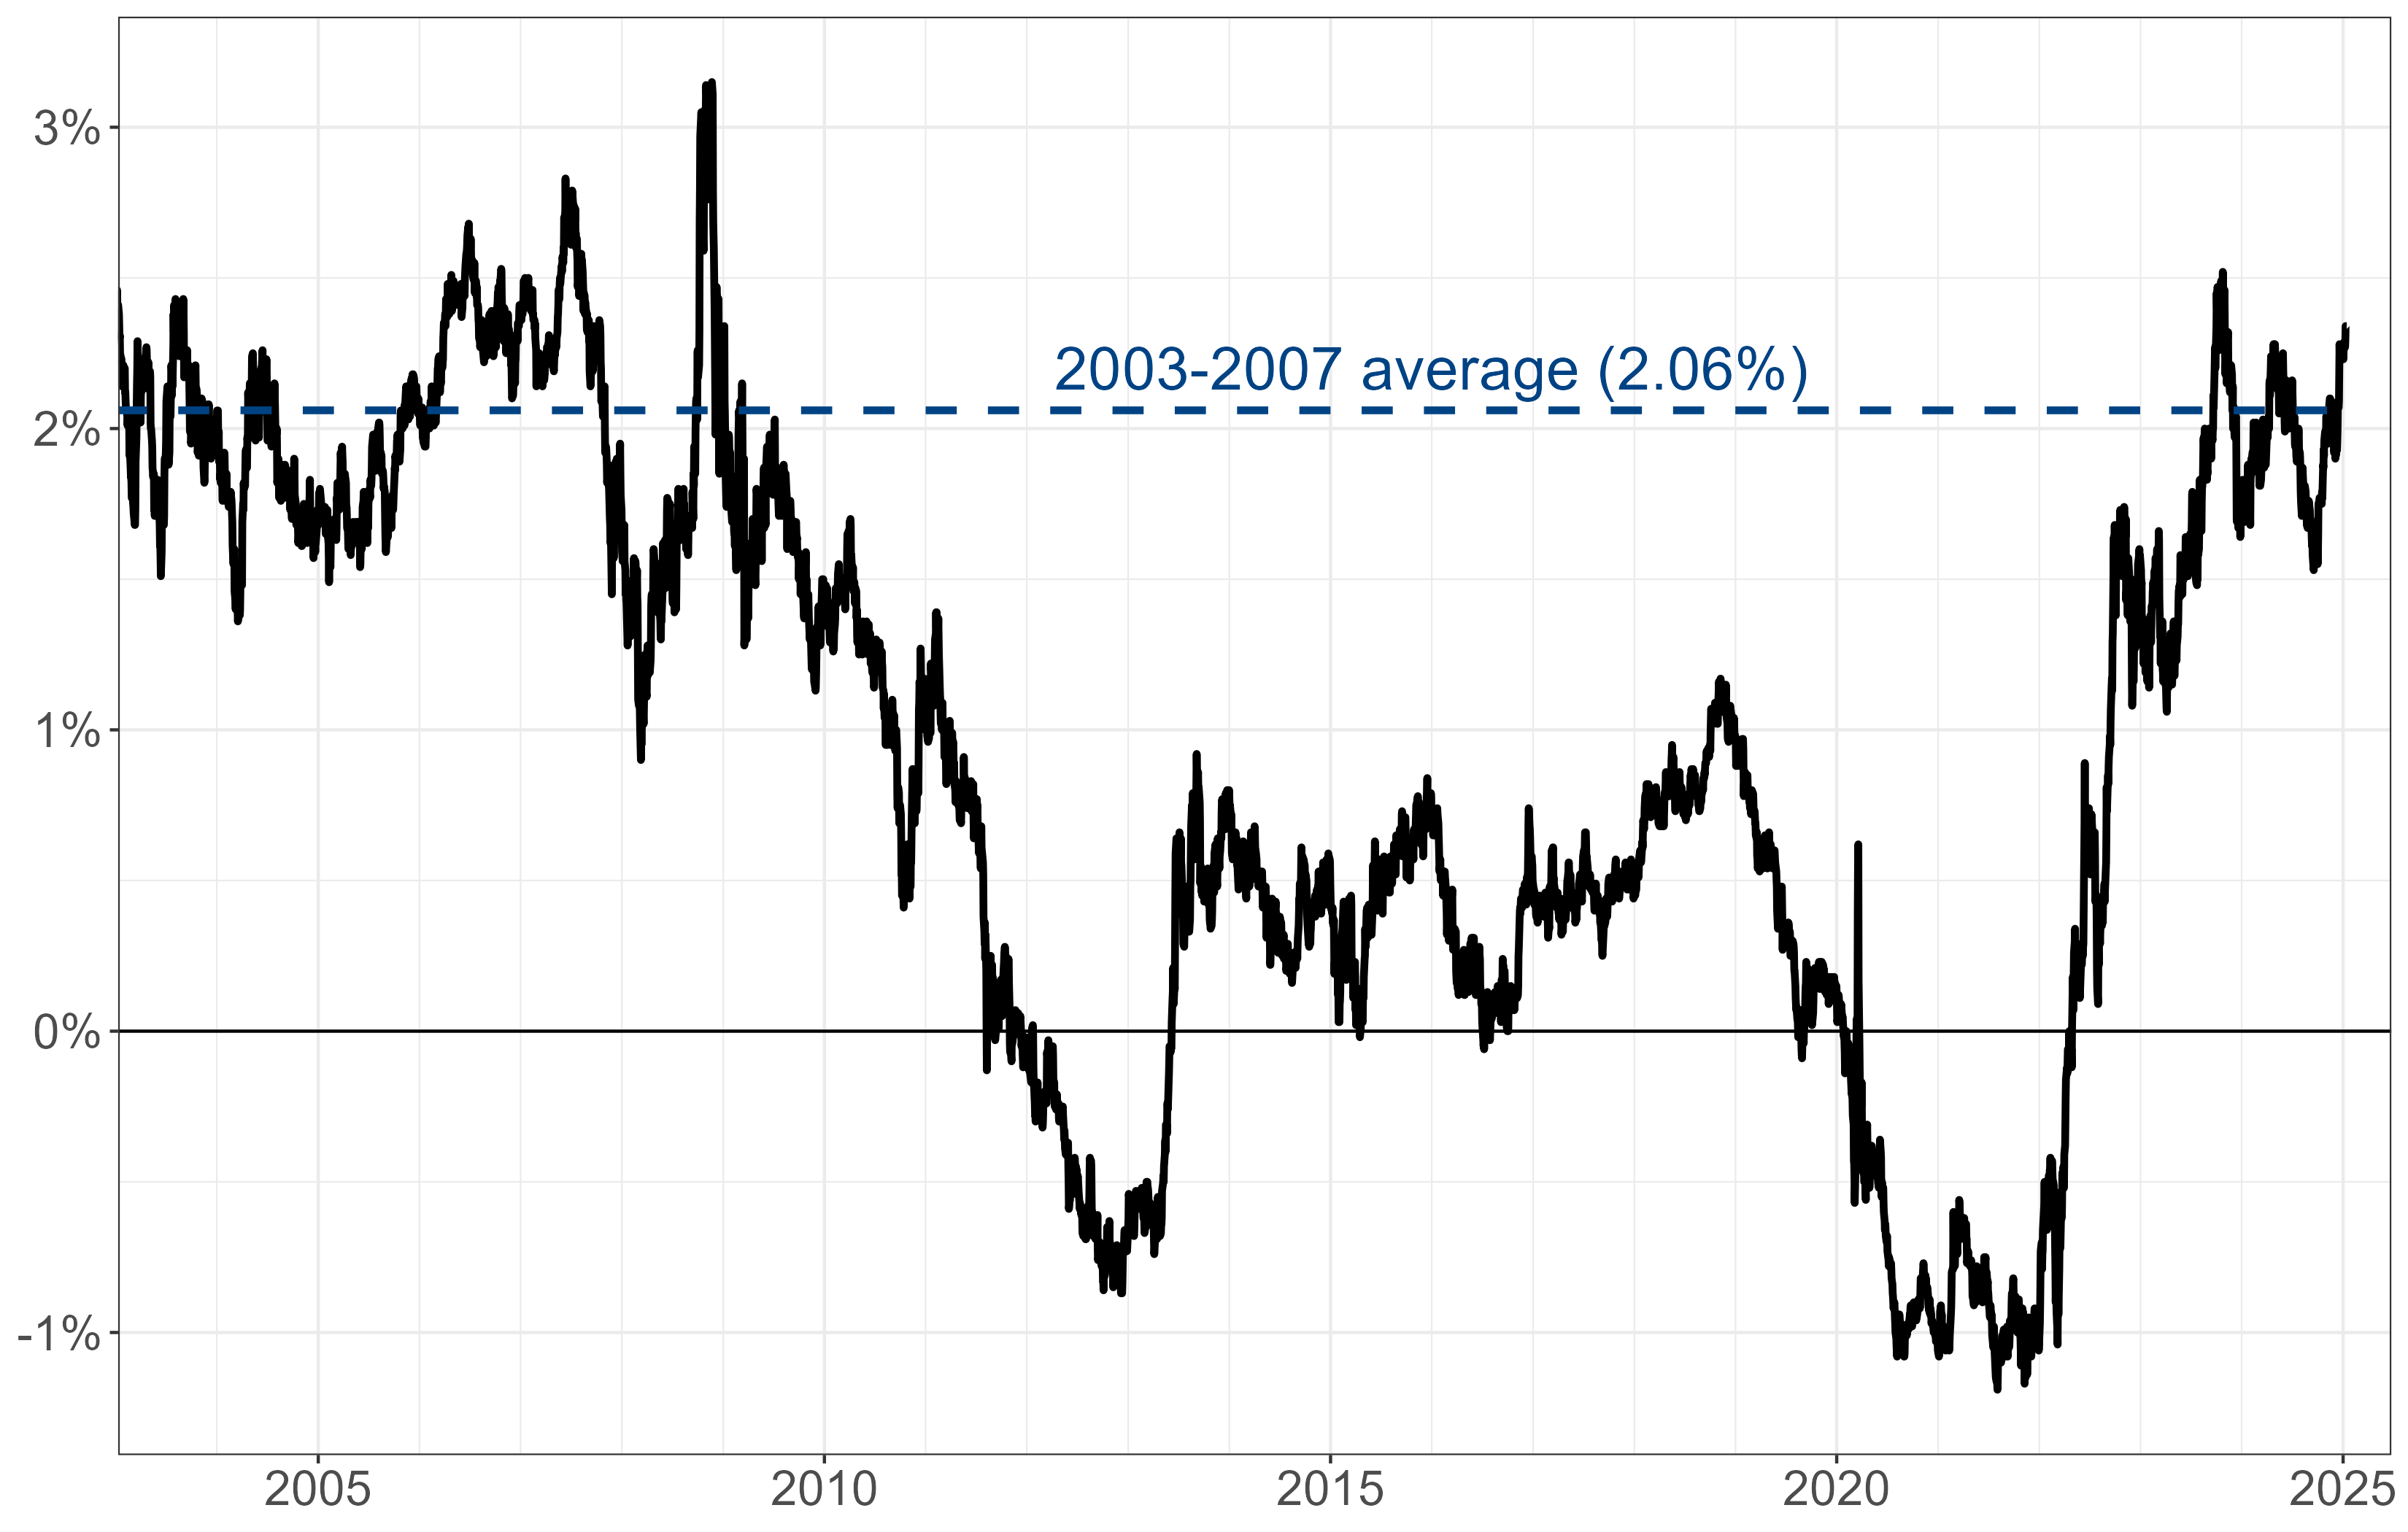
In our previous report (EPC, 2024), we noted that long-term real interest rates, based on the yields of inflation-indexed government bonds, have risen significantly in recent years. These rates are particularly relevant for assessing fiscal sustainability and the long-term cost of public debt. For instance, relatively high nominal interest rates on public debt may not pose a major concern if nominal tax revenues rise rapidly due to high inflation. By contrast, higher long-term real interest rates increase the (expected) long-term cost of public debt, requiring larger budget surpluses net of interest payments to stabilise the debt-to-GDP ratio.
Source: FRED.
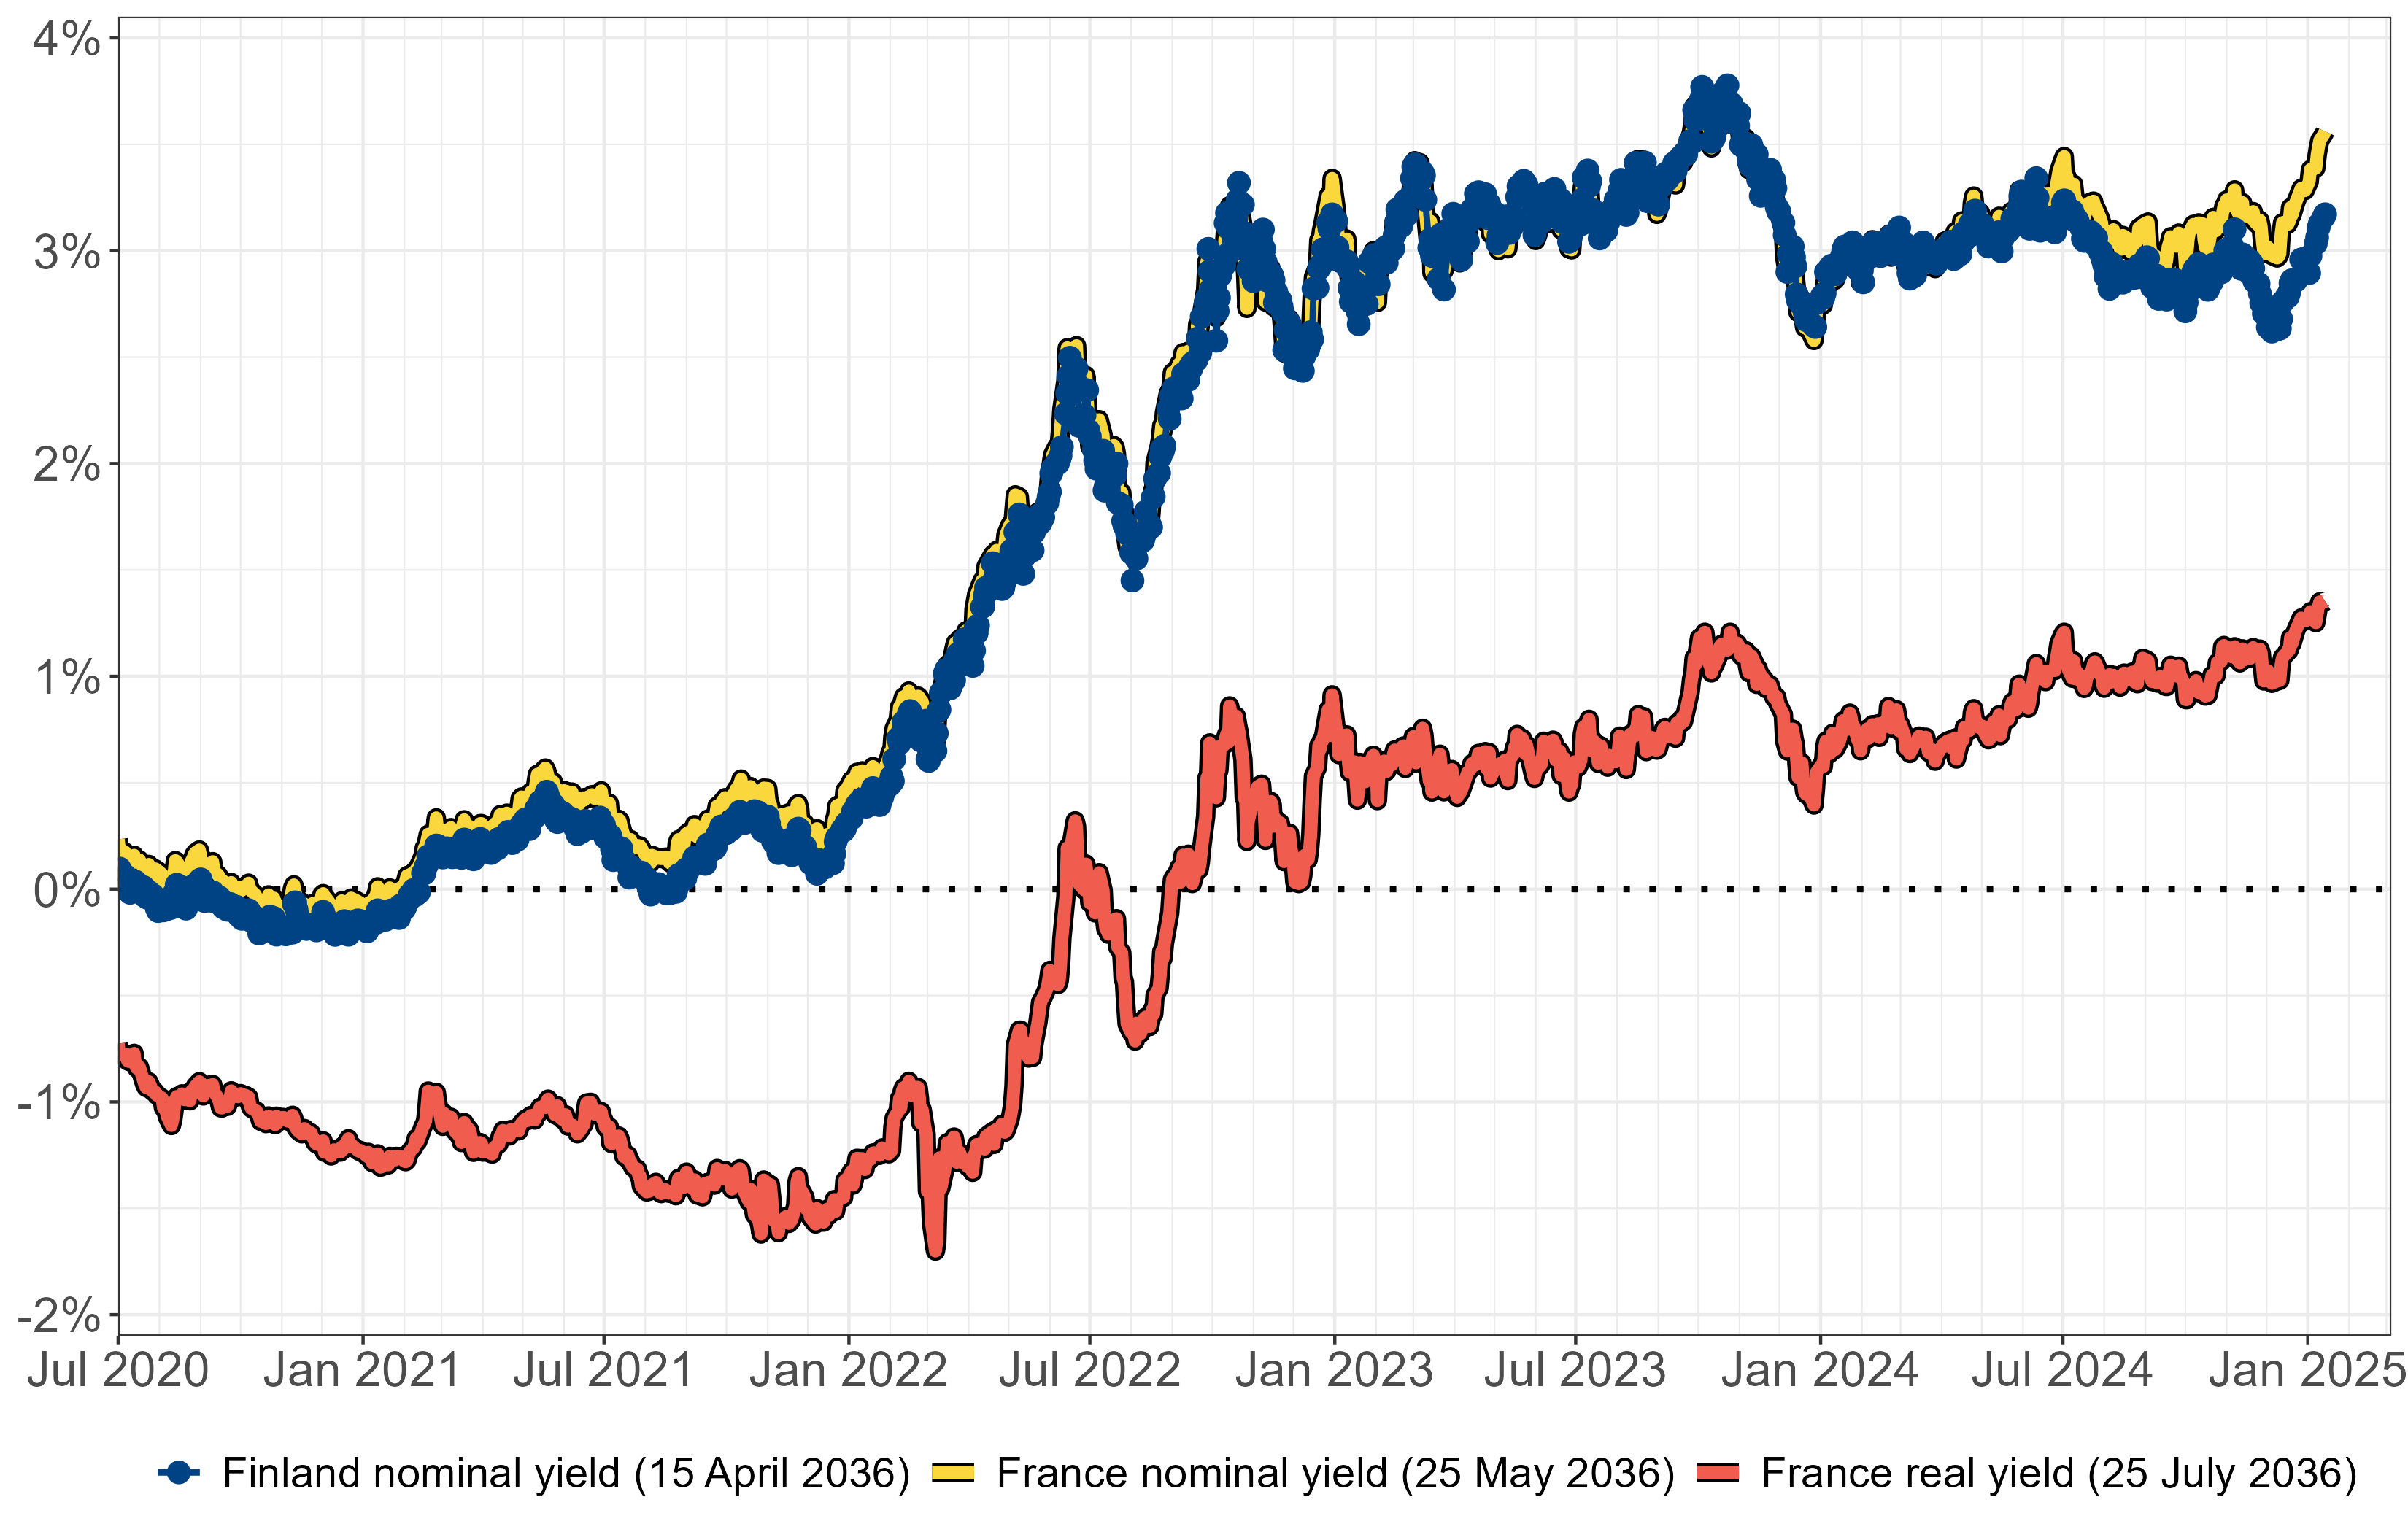
Sources: Bank of Finland (Reuters), Agence France Trésor (Bloomberg). Notes: Maturity date in parentheses. French real yield is for OAT€i, which is indexed to euro area HICP.
Figures 2.2.2 and 2.2.3 show that real interest rates have remained relatively stable in 2024. Figure 2.2.2 plots a time series of the interest rate on 10-year inflation-indexed US government bonds, which rose sharply from 2022 to 2023 but hovered around throughout 2024. Similarly, the yield on the inflation-indexed French government bond, shown in Figure 2.2.3 (red line), increased in 2022 but remained largely unchanged in 2024 compared to 2023. The market yield on the French bond serves as a good proxy for Finland’s real interest rate environment, as the nominal yields of Finnish bonds (blue dots) and French bonds (yellow line) of similar maturities have tracked each other closely, as seen in Figure 2.2.3.
The Finnish labour market has certainly cooled from recent years: unemployment has risen while employment and open vacancies have gone down. Based on Statistics Finland’s monthly labour force survey data, the number of employed persons fell by an average of 18,000 and the number of unemployed persons rose by 33,000 between December 2023 and November 2024 compared with the same period the previous year (Table 2.3.1). The Ministry of Finance (2024b) forecasts that weak labour market conditions will persist in 2025: the unemployment rate is forecast to be in 2025 compared to in 2024.
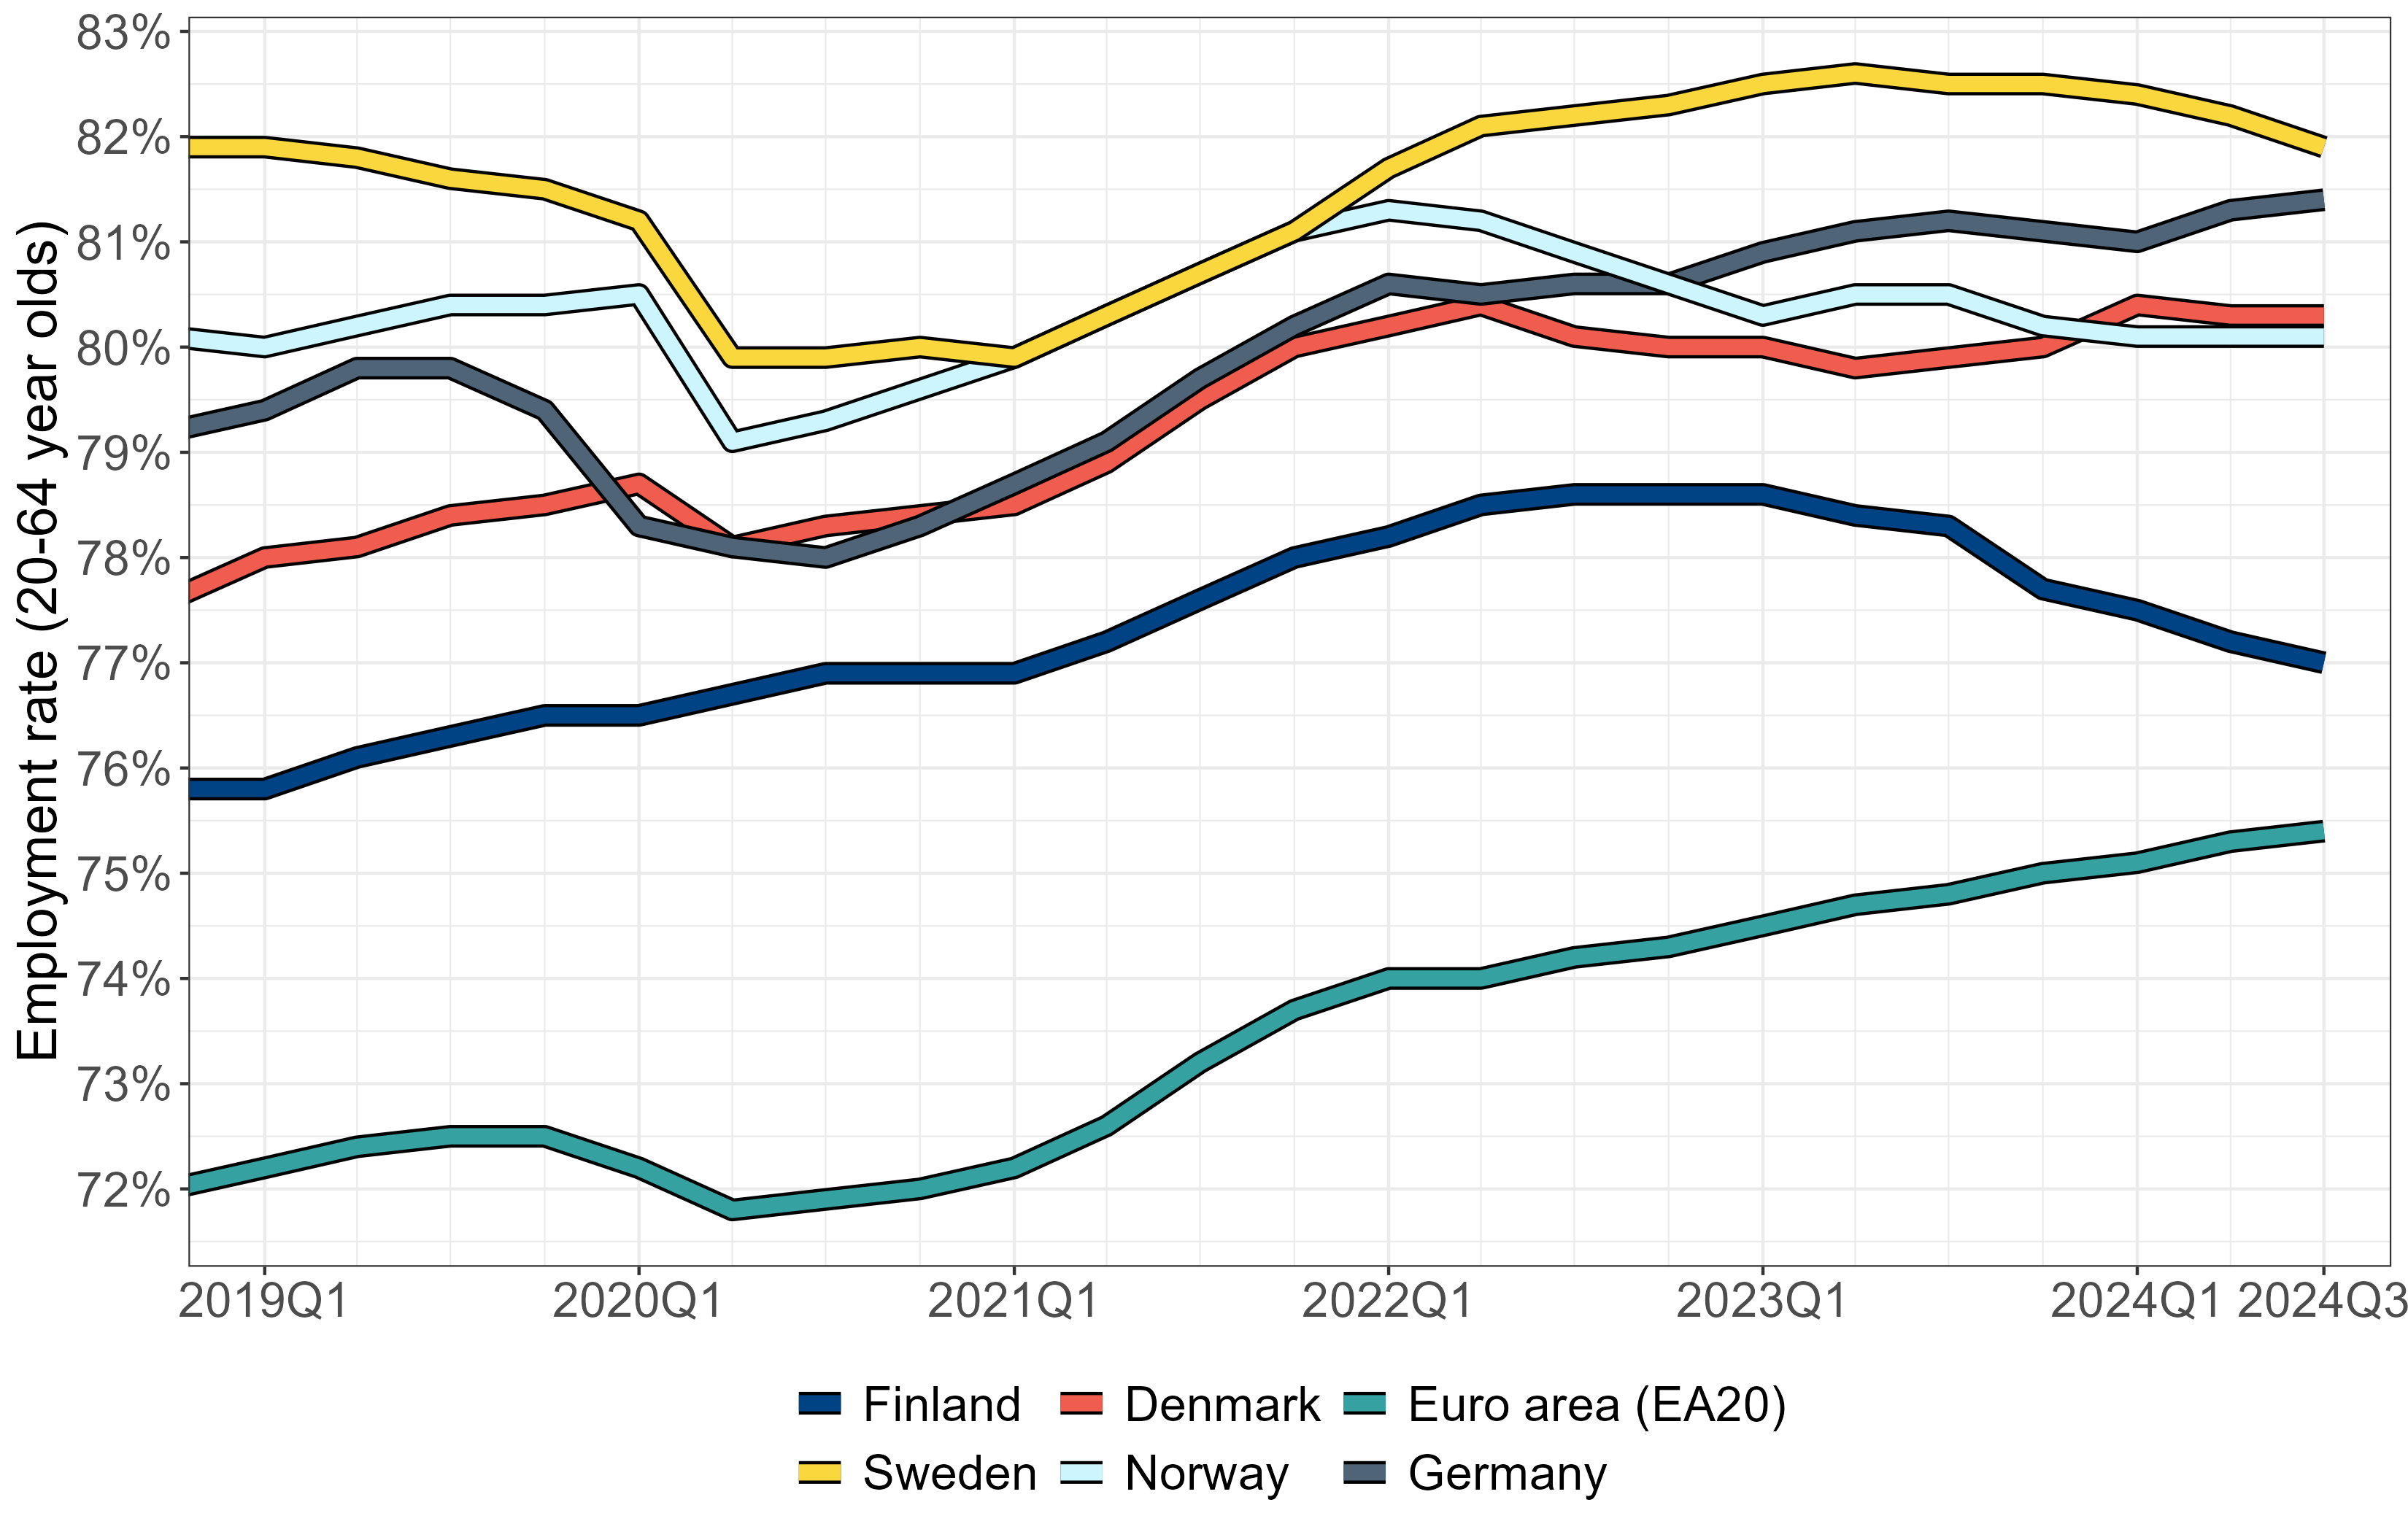
In an international comparison among the group of countries in Figure 2.3.1, Finland’s employment rate has experienced the largest decline since the beginning of 2023. The employment rate of 20-64 year olds has dropped from in the first quarter of 2023 to in the third quarter of 2024. The gap in employment rates between Finland and the other Nordic countries has widened recently, although employment rates have also declined in Sweden and Norway. Still, when compared to its historical trends, Finland’s employment rate remained relatively high in 2024, as the annual employment rate for 20–64 year olds has only been higher in 2022 and 2023.
Looking ahead, the Ministry of Finance forecasts that the employment rate will decrease slightly to 76.3% in 2025, before rising to 76.8% in 2026, c.f. Ministry of Finance (2024b). The forecast assumes that the government’s measures to boost employment will gradually start to take effect but other factors such as the weak economic cycle mean that employment growth in the latest forecast is weaker than, for example, in the previous Ministry of Finance (2024a) forecast.
Source: Eurostat.
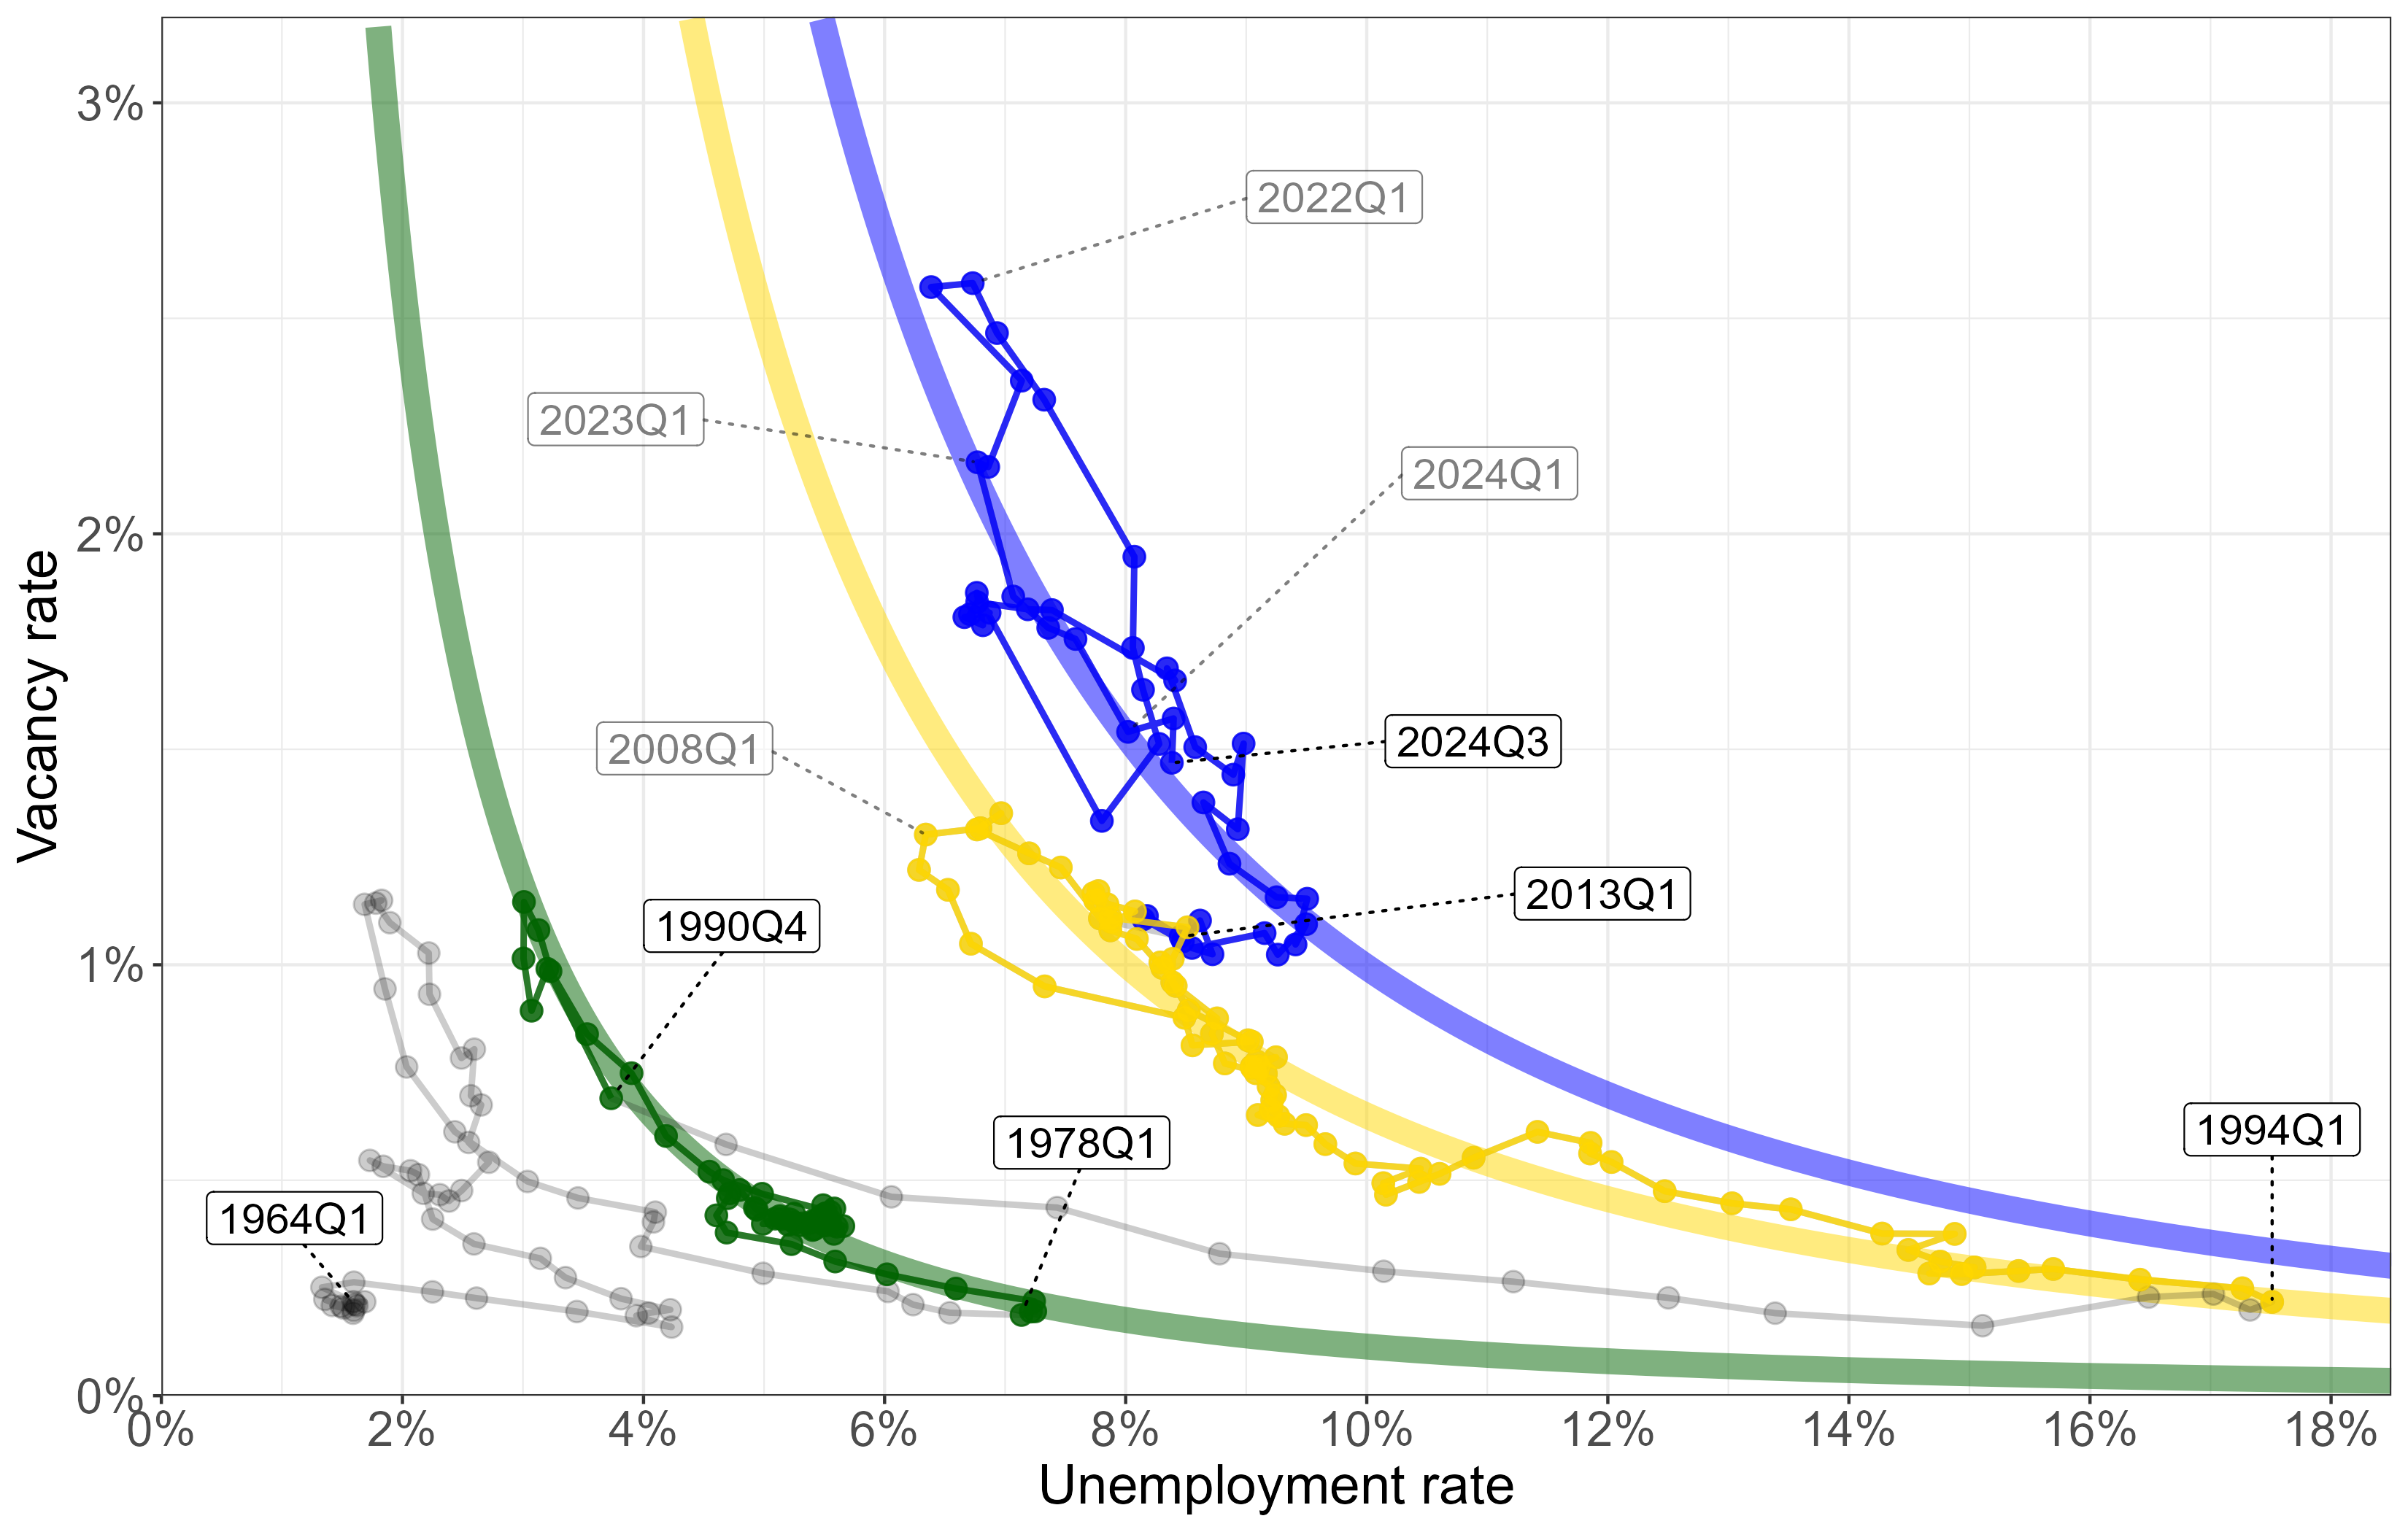
Figure 2.3.2 plots the Beveridge curve for Finland, following the analysis of Gäddnäs and Keränen (2023). The Beveridge curve describes the relationship between vacancies and unemployment: a higher vacancy rate is typically associated with a lower unemployment rate and vice versa. The figure shows a marked decline in vacancies and, as can be seen in the figure, vacancy and unemployment rates have recently moved more or less along the blue Beveridge curve, which represents the historical relationship between these two variables in recent Finnish data.
Source: Gäddnäs and Keränen (2023), updated with more recent data from Eurostat. Notes: The coloured Beveridge curves represent average positions of the curve in 1978-1990 (green curve), 1994-2012 (yellow curve) and 2013- (blue curve).
The cooling of the labour market has therefore materialised as a downward movement along the curve, characterised by fewer vacancies and higher unemployment. During the period from 2024Q1 to 2024Q3, there were fewer than open vacancies per unemployed person, compared to a ratio of approximately in 2022. In other words, labour market tightness in 2024 has been roughly half of what it was in 2022.
This shift suggests that Finland’s labour market is experiencing reduced tightness, potentially due to increased unemployment and fewer available jobs. The alignment with the historical Beveridge curve indicates that these changes are consistent with past labour market dynamics, implying no major change in structural mismatches between job seekers and employers.
Finland is experiencing a more severe economic downturn than the Nordics and the broader euro area, influenced by factors such as trade sanctions related to the Russian invasion of Ukraine and subsequent disruptions in foreign trade. GDP growth projections for 2024 have been significantly downgraded since autumn 2023, highlighting the persistence of the economic downturn. However, positive growth observed in more recent quarters may indicate the beginning of a stabilisation phase. Private investment in particular has contributed negatively to aggregate growth in the last two years but is expected to contribute positively in 2025.
Inflation in Finland has decreased to below , enhancing consumer purchasing power. The most recent data, however, indicates a slight uptick in inflation compared to previous months, mostly attributable to the VAT hike implemented in September 2024 and some correction measures in the data.
Following central bank rate cuts, short-term nominal interest rates in Finland have begun to decline. These lower rates, particularly relevant for most mortgage borrowers, are expected to boost aggregate demand in 2025. In contrast, long-term real interest rates, which are critical for assessing the long-term fiscal cost of public debt, have remained relatively stable following their sharp increase between 2022 and 2023.
Finland has experienced the largest employment rate decline among its Nordic peers since early 2023, although its employment rate remains relatively high compared to historical trends. The Ministry of Finance forecasts a slight decrease in the employment rate in the near term, followed by a modest increase as government measures to boost employment gradually take effect. Analysis of the Beveridge curve indicates reduced labour market tightness, consistent with cyclical dynamics and no significant change in structural mismatches between job seekers and employers.
The wellbeing services counties (WSCs) were established in 2021. Responsibility of providing health and social care and rescue services started as of January 1st 2023, and the WSCs have autonomy in the way in which statutory services are organised and provided. Their financing is mainly based on central government funding. One of the aims of the social and health care reform was to slow down growth in expenditure, and the funding model has some built-in incentives to achieve this. At the same time, the funding must be sufficient to ensure that statutory services are provided to all citizens throughout the country.
The funding of the wellbeing services counties forms a significant proportion, approximately , of the central government budget in 2025. Therefore, an analysis of the WSCs’ finances is crucial from the perspective of the central government budget and public finances as a whole.
Funding for the wellbeing services counties is based on universal imputed central government funding (Act on Funding for the Wellbeing Services Counties 617/2021). Counties have broad autonomy in the use of funding. In addition to central government funding, the counties can collect client and service fees. First, we review the factors that determine the level of funding at the national level.
The level of central government funding in the first year of operation, 2023, was based on the total amount of net expenditure by the municipalities on health and social care and rescue services in 2022, totalling EUR 21.9 billion. Net expenditure means that e.g. client fees and other central government grants are subtracted from the total operating expenditure, so the net expenditure represents the actual amount of expenditure the counties will have to cover by central government funding.
Each year, the level of funding is increased in advance by the wellbeing services counties Price Index (WSC price index, calculated by the MoF). This is a composite index consisting of of the general wage index, of the consumer price index and of the change in employers’ social insurance contributions. The composition of the index is such that the counties cannot directly influence any of its components through their own actions. The WSC price index is set for each year in conjunction with the autumn forecast of the previous year. This is to provide predictability in the level of funding for the following year.
The level of funding is also adjusted annually by the estimated growth in the need for services at the national level (calculated by the Finnish Institute for Health and Welfare, THL1 ). This growth estimate is linked to the Statistics Finland population projection, and it projects the annual increase in the need for services. It is updated every four years, with growth estimates for the following four-year period written into the law to provide predictability in the level of funding for the following years. The current estimate of growth in the need for services is approximately in 2023-2027, so funding will increase by approximately EUR 250 million each year.
As the wellbeing services counties have to be able to provide statutory services with central government funding, any legislative changes in their statutory services are taken into account in the level of funding. If statutory tasks are increased or requirements are extended, the funding is increased accordingly, based on the estimated change in costs. This is to ensure that new service obligations are fully funded. If the statutory tasks or requirements are reduced, the funding is reduced by a corresponding amount.
In addition to the revisions made in advance each year, the level of funding is also revised ex post. This ex-post revision of funding is done with a two-year lag and aims to ensure that actual costs at national level do not diverge from the level of central government funding in the longer term.
The ex-post revision of funding is based on the difference between the national level of funding and total net expenditure. If the realised expenditure has exceeded the funding, the shortfall is added to the national level of funding with a two-year lag. The first ex-post revision of funding will take place in 2025, based on the difference between central government funding and the net expenditure realised in 2023. From 2026, the amount of the ex-post revision will take into account the change in the deficit or surplus of the WSCs and the amount of the ex-post revision already added to the funding.
For example, the deficit in 2023 was EUR 1.3 billion, so the first ex-post revision is EUR 1.3 billion, which is added to the funding in 2025.2 The estimated deficit in 2024 is EUR 1.4 billion, i.e. the deficit has increased by EUR 100 million compared to 2023. As the first ex-post revision of EUR 1.3 billion is added to the funding in 2025, the revision in 2026 will add the remaining EUR 100 million. In total, there is a cumulative ex-post revision of EUR 1.4 billion in 2026, which corresponds to the shortfall in funding in 2024.3
The increase (or decrease) in funding is allocated to each county according to the imputed criteria described in more detail below. This means that funding shortfalls in individual counties are not covered on a one-to-one basis. If a county’s share of the total deficit is greater than its share of central government funding, the ex-post revision will only partially cover its deficit. On the other hand, if the county’s share of the deficit is smaller than its share of the funding, the ex-post revision will exceed its deficit. This should provide incentives to keep cost growth under control.
The level of total funding for each budgetary year is determined as described above. The allocation of funding to individual counties is based on imputed criteria, with weights specified in legislation.
To reflect differences in population structure and morbidity, the largest share of the funding, approximately , is allocated on the basis of county-specific service needs for health care, elderly care and social care calculated annually for each county by the Finnish Institute for Health and Welfare.
The need for services is first estimated using nationwide individual level data.4 The estimated need for services for each individual is then summed up at the county level to calculate the total need for health and social services in a given county. Finally, the relative coefficients used to allocate funding across counties are calculated by dividing the average need of each county by the national average. A coefficient greater than 1 in health care, elderly care or social care means that the need for services in that sector is higher than the national average, while a coefficient less than 1 means that the need for services in that sector is lower than the national average.
The relative coefficients for each of the three sectors are updated annually for each county based on the latest available data. The imputed funding should therefore be as up to date as possible in capturing changes in the population structure, morbidity and socio-economic factors across the counties.
Approximately of the funding is allocated on a per capita basis. The remaining imputed criteria reflect other county-specific conditions, such as the proportion of bilingual or foreign-language speakers or the population density. The most recent population data is used each year to ensure that the imputed funding reflects changes in the population.
In addition to the imputed funding, there is a county-specific transitional equalisation that is either added to or subtracted from the funding for each county. The purpose is to smooth the transition from the municipal service provision system to WSC-based service provision with full central government funding. The additions and subtractions will decrease over a graded transition period in 2023-2029.
The wellbeing services counties are mainly funded by central government. As the counties do not have the right to levy taxes, the WSCs’ finances are more strictly regulated than those of the municipalities. The wellbeing services counties are obliged to make a financial plan for the following three years that is balanced or in surplus.
If a county runs a deficit, it has to cover it within three years, i.e. a deficit incurred in 2023 and any additional deficit thereafter must be covered by the end of 2026 (Act on Wellbeing Services Counties 611/2021). For example, if a county has a deficit of EUR 10 million in each of the years 2023, 2024 and 2025, it must generate a surplus of EUR 30 million in 2026 to cover the accumulated deficit.
As will be discussed in more detail below, all counties (except Helsinki) were in deficit in 2023. If a county does not manage to generate the required surplus by the end of 2026, it may be subject to an assessment procedure, which means stricter central government control. On the other hand, if it manages to generate the required surplus by the end of 2026, it can in principle run a new deficit in 2027, with a new three-year period to cover it.
The relatively short period for covering deficits is intended to prevent the accumulated deficit in any one county from becoming too large. As counties do not have the right to levy taxes, they must cover the deficit with an equivalent surplus within the limits of central government funding.
Central government funding has to be sufficient for the provision of statutory services while providing some cost control at the same time. The funding model has some built-in incentives to curb growth in social and health care expenditure by keeping the financial framework tight. First, the imputed funding is based on the average cost per service. Given that the funding is also universal, this means that if a county can provide certain services at a lower than average cost, it can use the leftover funding to provide some other services.
Second, the composition of the WSC price index as described above provides some control over cost growth, as it is constructed in such a way that counties cannot directly influence its components.
Third, while the amount of the ex-post revision is based on the funding shortfall at national level, it is allocated to counties in the same proportion as their imputed funding, not in the same proportion as their realised deficits (or surpluses). The first ex-post revision in 2025 fully covers the funding shortfall in WSC finances in 2023. From 2026, the annual increase or decrease in funding through the ex-post revision will be partial (HE 70/2024).
In 2026, the ex-post revision will cover of the increase or decrease in funding. As described in the example above, if the deficit in 2024 is EUR 100 million higher than in 2023, a full ex-post revision would add EUR 100 million to the national level of funding in 2026. With a revision the increase will be EUR 95 million. The partial ex-post revision will thus reduce funding by EUR 5 million compared to a full revision in 2026. On the other hand, if the deficit in 2024 were EUR 100 million lower than in 2023, the full ex-post revision would reduce funding by EUR 100 million. The revision would reduce funding by EUR 95 million, i.e. the funding would be EUR 5 million higher than with a full revision. The increase or decrease will gradually decrease to of the revision in 2029.
In addition to the incentives built into the central government funding model, the obligation to cover deficits within a three-year period combined with the threat of being subject to stricter central government control is expected to act as a further incentive to curb cost growth.
The first year of operation was financially difficult for the wellbeing services counties. The deficit in the WSCs’ finances was EUR 1.3 billion in 2023, and is projected to be even higher in 2024. In this section we first discuss the reasons for these high deficits at national level, and then assess the required consolidation to achieve balanced WSC finances by the end of 2026.
Expenditure growth in the wellbeing services counties has been very rapid. Net expenditure on health, social and rescue services amounted to EUR 24.5 billion in 2023. It increased by EUR 2.6 billion compared to what the municipalities spent on these services in 2022, representing nominal growth of . The main reasons for the high expenditure growth in 2023 are the wage agreement in the health and social care sector, high inflation, and increased reliance on expensive agency doctors.
Approximately of total operating expenditure in 2023 was spent on personnel costs, most of which were wages and salaries for own staff. In the summer of 2022, a new wage agreement was negotiated in the municipal sector for the years 2022-2025, linking wage increases in the municipal sector to wage increases in export industry. In October 2022, a further wage agreement was reached in the social and health care sector, including integration and development of pay systems. According to the Ministry of Finance (2024a), wages and salaries in the WSCs increased by in 2023. The wage agreement also has an impact on costs in 2024 and 2025, and the Ministry of Finance projects wages and salaries in the WSCs to increase by in 2024 and in 2025.
In 2023, of operating expenses were spent on the purchase of services. This was almost , or EUR 1.2 billion more than the WSCs had budgeted for 2023. The use of agency doctors and nurses increased due to labour shortages in many counties. Also, contracts with private service providers, especially in elderly care, were renewed in 2023 with high price increases. In addition to the increase in personnel costs, inflation also remained high in 2023, with the consumer price index rising by .
The previous government also implemented stricter requirements for 2023 in the midst of labour shortages that may have increased cost pressure in the counties. The minimum staffing requirement for elderly care was increased from the beginning of April 2023, and the maximum waiting times for access to care were shortened. It is possible that these stricter requirements forced the counties to increase salaries to attract qualified staff or to increase the use of agency doctors and nurses to meet the requirements.5
The above reasons explain the cost increases in 2023. The high level of expenditure in 2023 may also reflect inaccuracies in final net expenditure in 2022. In the reform, total net expenditure on social and health care and rescue services in 2022 defined the cuts in municipalities’ funding. The higher the total expenditure, the higher the cuts in central government transfers to municipalities. The municipalities therefore had an incentive to underbudget social and health care costs in order to minimise the cuts to their own funding.
Some of the underbudgeting was corrected afterwards using the final expenditure data for 2022. According to the municipalities’ draft budgets for 2022, total expenditure for social and health care and rescue services was EUR 21.2 billion. This was revised upwards by around EUR 650 million on the basis of the municipalities’ financial statements and some specific accounting entries that distorted the actual amount of spending on these services (Decree 886/2023). However, despite these revisions, it is still possible that the municipalities minimised the impact of the reform on their own finances by limiting their spending on health care and social services in the pre-reform years.
The COVID-19 pandemic distorted service provision in the pre-reform years by causing treatment queues as many treatments were postponed. These queues were at least partially resolved in 2022, but it is difficult to say to what extent 2022 was a normal year for the provision of health and social care services. The pandemic also distorted the financing of health services, as central government compensated the municipalities for the extra costs associated with it. If the government grants exceeded the pandemic-related costs, the net expenditure may have been too low for some municipalities. As the total amount of net expenditure was used as the basis for central government funding to the WSCs, excessive pandemic-related grants mean that there might be a permanent shortfall in the national level of funding.6
Finally, there are always start-up costs associated with reforms of this scale. The transfer of service provision from the municipalities to the wellbeing services counties required, for example, integration of the service, ICT and wage systems. Central government has funded these start-up costs through separate grants, but it is likely that the costs have exceeded these grants.
In August 2024, the wellbeing services counties reported their projections for 2024. According to these, expenditure growth in 2024 was estimated to be . Wages in the social and health care sector were still growing more than the general wage index, but inflation slowed down. As growth in expenditure slowed from 2023, it may indicate that the counties have begun implementing various savings and productivity-increasing measures. The Ministry of Finance forecasts that expenditure growth will remain around in the coming years too.7
While expenditure has grown rapidly, central government funding has not grown at the same rate. As described in section 3.1, the level of central government funding in 2023 was defined by the total net expenditure (EUR 21.9 billion) of municipalities on health and social care and rescue services in 2022. The EUR 650 million revision discussed above has been corrected both in the central government funding for 2023 in a one-off payment in January 2024 and in the level of central government funding from 2024 onwards. The funding base should thus reflect the actual final expenditure of the municipalities in 2022.
The funding for 2023 was increased by the WSC price index () and by the estimated growth in the need for services (). The changes in statutory tasks brought in by the previous government were also taken into account with a corresponding increase in funding.
In total, central government funding for 2023 was EUR 23.2 billion, which was , or EUR 1.3 billion higher than what the municipalities spent in 2022. Against the increase in expenditure, the deficit in 2023 was EUR 1.3 billion. In 2024, funding grew by compared to 2023, while expenditure growth is estimated at , resulting in a projected deficit of EUR 1.4 billion in 2024.
Funding has grown much less than expenditure primarily due to the way the WSC price index is constructed and applied. The index reflects changes in the general wage level with a weight, with wage increases in the social and health care sector that exceed increases in the general wage level being only partially captured.
For 2023, the WSC price index used to determine funding levels was based on the Ministry of Finance’s autumn 2022 forecast (Ministry of Finance, 2022), which preceded the final wage agreement for the social and health care sector. At that time, the general wage index was estimated to increase by . After incorporating the actual wage agreement, the increase in the general wage level for 2023 was later revised to (Ministry of Finance, 2024a).
Additionally, of the WSC price index is based on the consumer price index (CPI) forecast. The funding level for 2023 was determined using the autumn 2022 forecast of inflation, whereas the realised inflation rate was significantly higher at (Ministry of Finance, 2024a).
In other words, the funding was based on wage and consumer price inflation forecasts that both turned out to be lower than the actual realisations. Consequently, the WSC price index for 2023 was underestimated relative to the actual increase in costs. Ex-post, a rough estimate of the “correct” WSC price index increase for 2023 would be ,8 whereas funding was based on an increase of just .9
This implies that the WSC price index used to adjust funding for 2023 was approximately 1.3 percentage points too low, implying a shortfall of around EUR 300 million. The resulting cumulative impact of around EUR 600 million for 2023 and 2024 is quite substantial. While the first ex-post revision of funding will correct the level of funding from 2025 onwards, it will not correct the funding for 2023 and 2024 ex-post.
As described above, the total deficit of the WSCs’ finances in 2023 is EUR 1.3 billion and the estimated deficit in 2024 is EUR 1.4 billion. To cover the accumulated deficit, the WSCs will have to generate a total surplus of EUR 2.7 billion by the end of 2026, within the limits of central government funding. Next, we will discuss the magnitude of the required consolidation to generate this surplus.
The first ex-post revision of funding is based on the total deficit in 2023. Adjusted to the price level of 2025, an ex-post revision of EUR 1.4 billion is added to the funding in 2025. In total, the funding increases by EUR 2.2 billion, or compared to 2024. In 2026, an ex-post revision of EUR 160 million is added to the funding, bringing the total ex-post revision to almost EUR 1.6 billion in 2026.
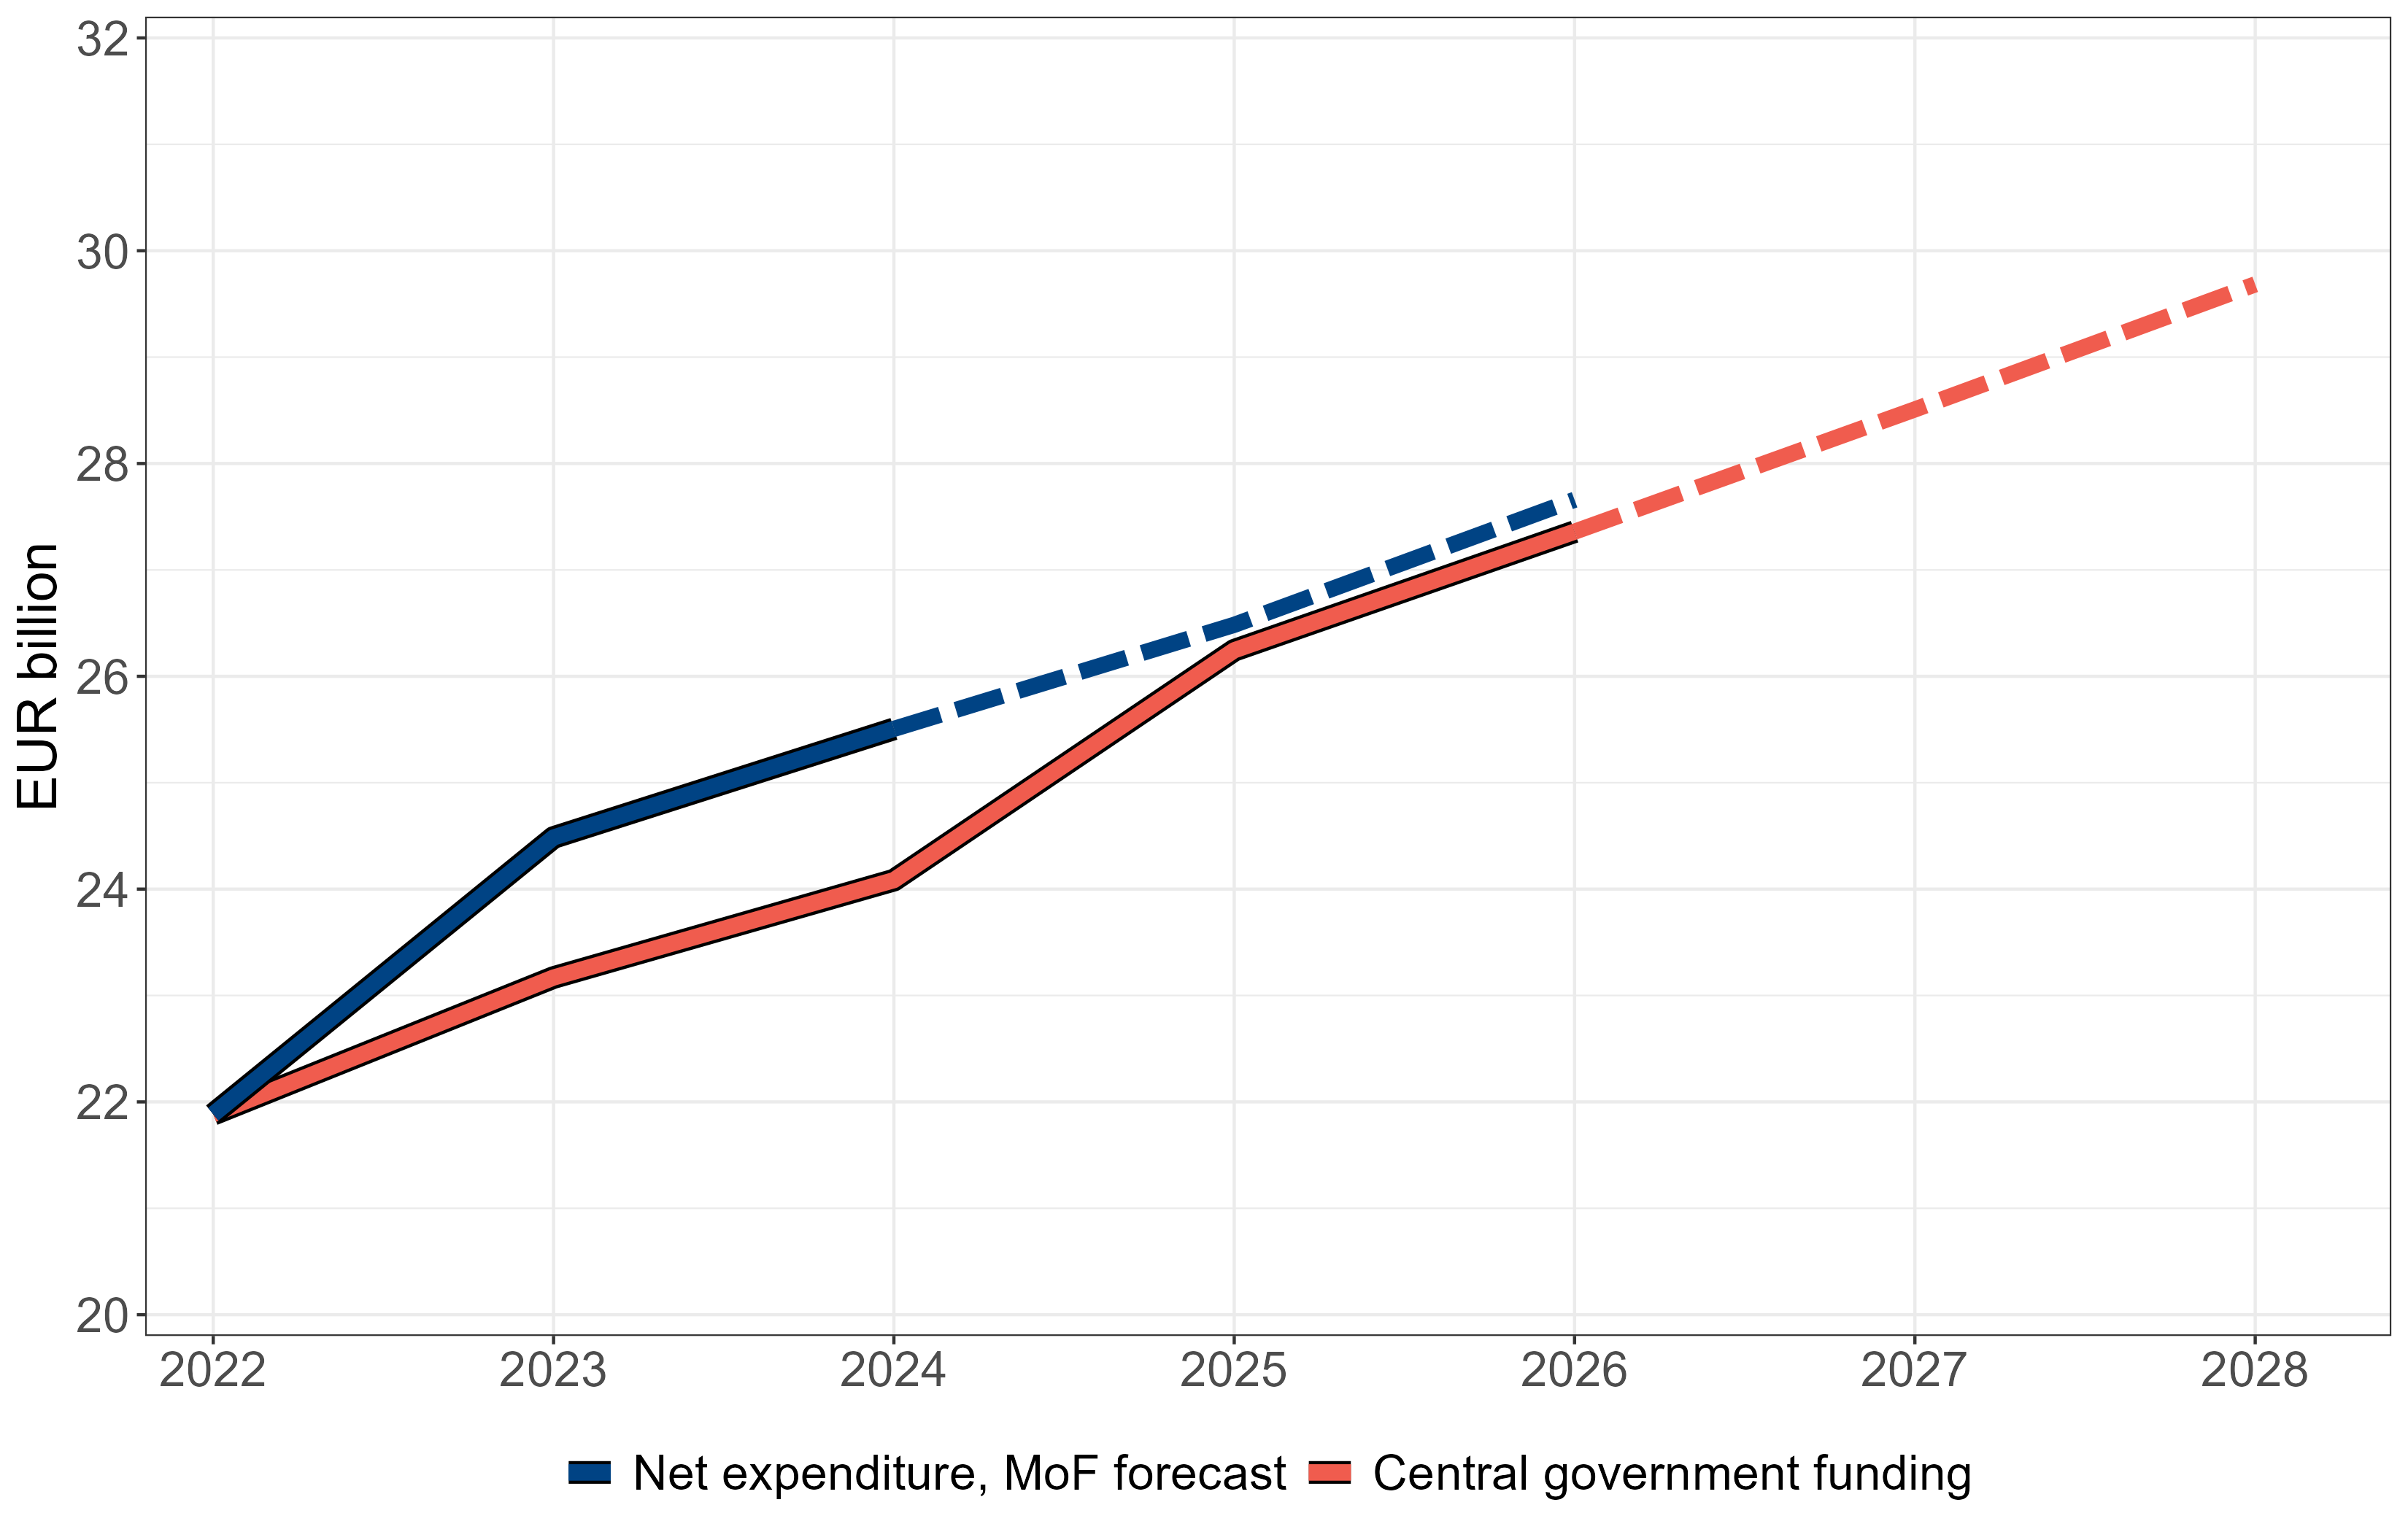
Sources: State Treasury, Ministry of Finance, and Council’s calculations. Notes: WSC expenditure in 2023 is based on realised data and in 2024 is based on an estimate. WSC expenditure in 2025 and 2026 (blue dashed line) is based on MoF autumn 2024 forecast. Central government funding in 2025 and 2026 accounts for deficits in 2023 and 2024. Central government funding in 2027 and 2028 (red dashed line) is calculated based on projected deficits in 2025 and 2026 given the path for expenditure in the figure.
Figure 3.2.1 shows realised expenditure in 2023 and estimated expenditure in 2024 (blue solid line). Expenditure in 2025 and 2026 is based on the Ministry of Finance’s autumn 2024 forecast10 , according to which net expenditure grows by approximately per year (blue dashed line). The figure shows the significant increase in funding in 2025 and 2026 (red solid line) based on the deficits in 2023 and 2024. The ex-post revision, and thus the total level of funding for the years 2027 and 2028 (red dashed line), is based on the projected deficits in 2025 and 2026.
Figure 3.2.1 shows that the substantial increase in funding will help to balance the WSCs’ finances as a whole, as with the ex-post revision the level of the central government funding converges to the level of expenditure. However, it is not sufficient to generate the required surplus if expenditure grows at the projected rate of per year in 2025 and 2026. The cumulative deficit would be close to EUR 3 billion at the end of 2026.
Instead, for the WSCs to be able to cover the accumulated deficit, growth in expenditure must be significantly lower in 2025 and 2026 than in the MoF projection. Given the same increase in funding in 2025 and 2026 (red solid line) as in Figure 3.2.1, Figure 3.2.2 shows an example of the maximum expenditure growth in 2025 and 2026 (blue dashed line) that would generate the required surplus by the end of 2026.
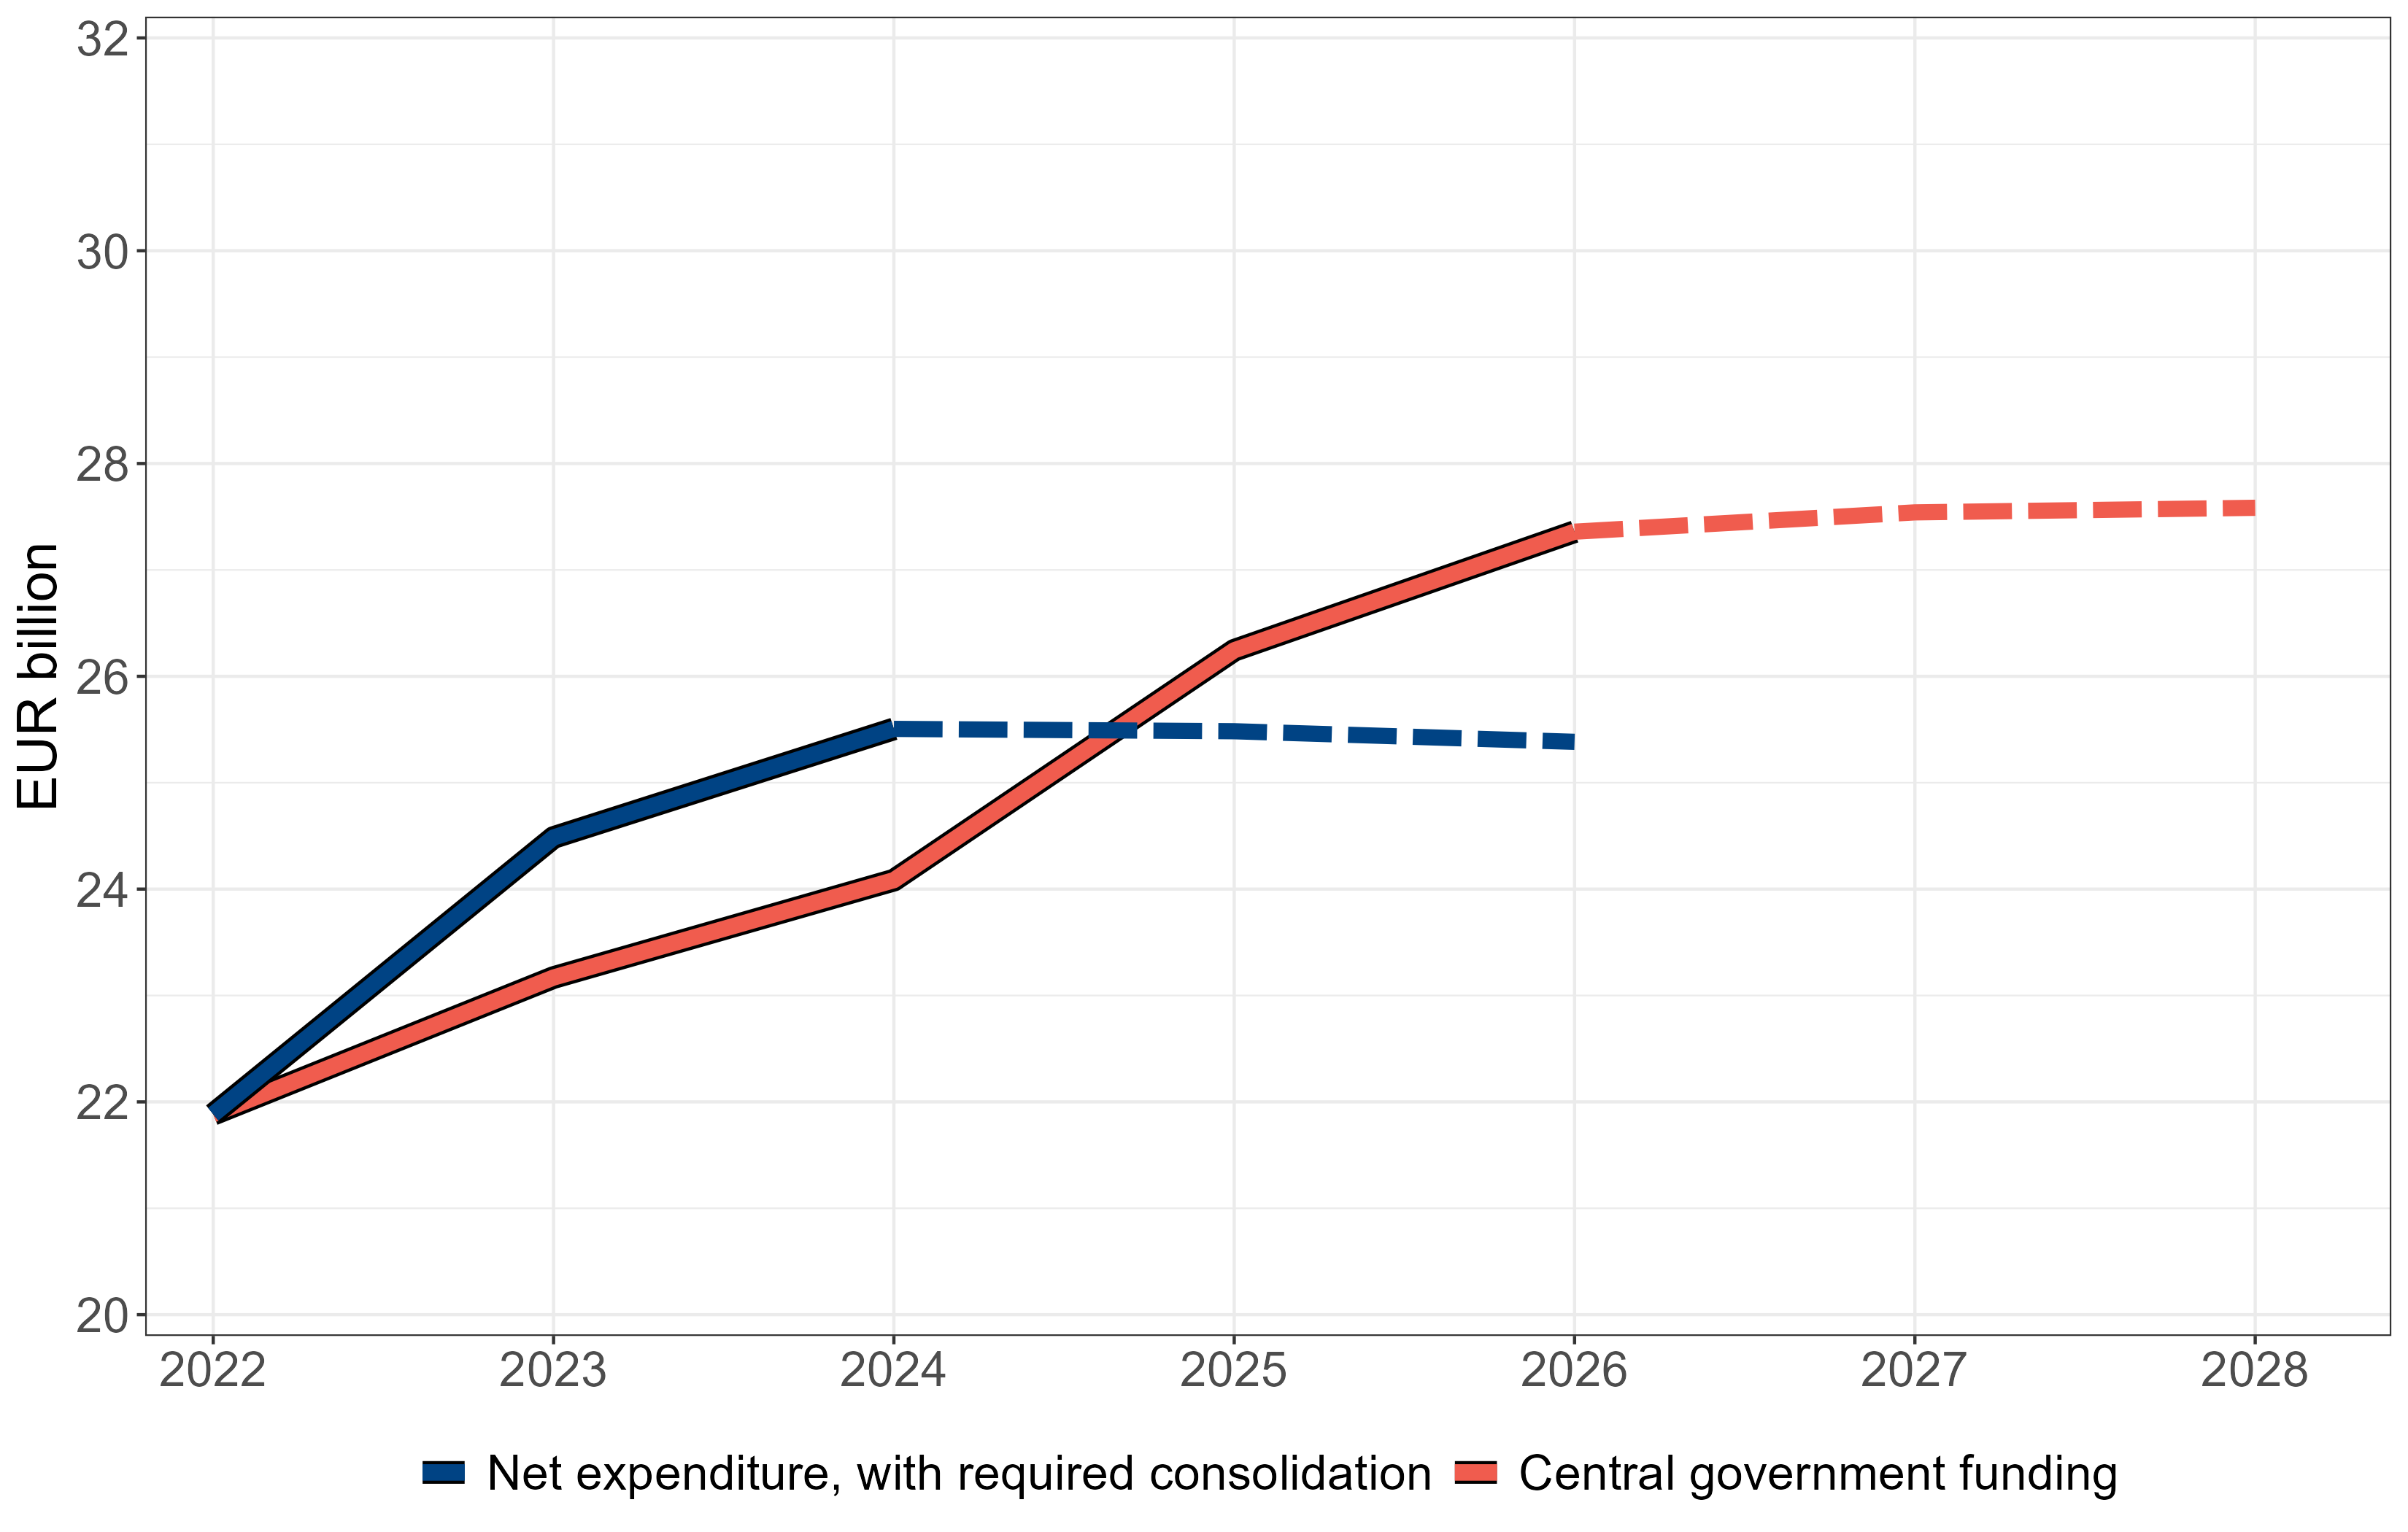
Sources: State Treasury, Ministry of Finance, and Council’s calculations. Notes: WSC expenditure in 2023 is based on realised data and in 2024 is based on an estimate. WSC expenditure in 2025 and 2026 (blue dashed line) is a scenario, in which the WSCs cut expenditure sufficiently to cover the accumulated deficits (see text for details). Central government funding in 2025 and 2026 accounts for deficits in 2023 and 2024. Central government funding in 2027 and 2028 (red dashed line) is calculated based on projected deficits/surpluses in 2025 and 2026 given the path for expenditure in the figure.
According to our calculations, at the national level, net expenditure in nominal terms should be approximately lower in 2026 than in 2024 to ensure a sufficient surplus in the WSCs’ finances by the end of 2026. This means that the level of expenditure would be approximately EUR 2 billion lower in 2026 than in the MoF forecast. The exact size of the required consolidation depends on the timing of the measures in 2025 and 2026.
Figure 3.2.2 shows that if the counties manage to cut their spending sufficiently to generate the required surplus, the level of funding is significantly higher than the level of expenditure at the end of 2026. Furthermore, while the ex-post revision reduces funding in 2027 and 2028 in response to spending cuts in 2025 and 2026, the level of funding in 2028 will not fully converge downward to the level of spending in 2026, as can be seen in Figure 3.2.2. This is because the annual ex-ante adjustments based on the WSC price index and the growth in the need for services partially offset the downward ex-post revisions. This means that while the level of funding is higher than expenditure at the end of 2026, it also remains higher in 2027 and 2028 (red dashed line).
As described in section 3.1, if the counties manage to generate the required surplus by the end of 2026 to cover the deficits incurred in 2023 and 2024, they can in principle start running a new deficit in 2027 with a new three-year period to cover it.
In the example shown in Figure 3.2.2, the level of central government funding is EUR 2 billion higher than expenditure in 2026. At the national level, this means spending could be increased by for the WSCs’ finances to be balanced, or even more to run a small deficit in 2027. This rapid increase in costs in 2027 would in turn mean an increase in funding with the two-year lag in 2029 due to the ex-post revision.
The WSCs’ finances are therefore potentially volatile. This volatility is caused by the large deficits in 2023 and 2024 that were at least partly caused by underfunding. The obligation to cover the deficits within a strict timeframe will force the counties to cut spending significantly in 2025 and 2026. As funding does not fully converge downwards to the level of expenditure, the counties can increase spending significantly in 2027.
If funding had been cumulatively the estimated EUR 600 million higher in 2023 and 2024 (other things constant), this would mean less pressure to consolidate in 2025 and 2026, and would potentially reduce the fluctuation in the level of funding in later years.
The partial ex-post revision described in section 3.1 can to some extent reduce the volatility in the longer term, as the ex-post revisions will cover only of the additions or reductions from 2029. Both the additions and reductions will be smaller than with the current model of ex-post revision. This means that the counties’ ability to increase spending is smaller, but also their need to cut spending in subsequent years is likely to be smaller. However, as the partial ex-post revision changes the amount of funding already from 2026, exact analysis of the partial ex-post revision would require assumptions about the counties’ responses to changes in funding.
Above, the WSCs’ finances have been analysed as a whole. It is important also to analyse the individual counties, as there is a great deal of heterogeneity between counties in terms of population structure, geography, integration of the service structure and finances. Next, we discuss the financial outlook at the county level.
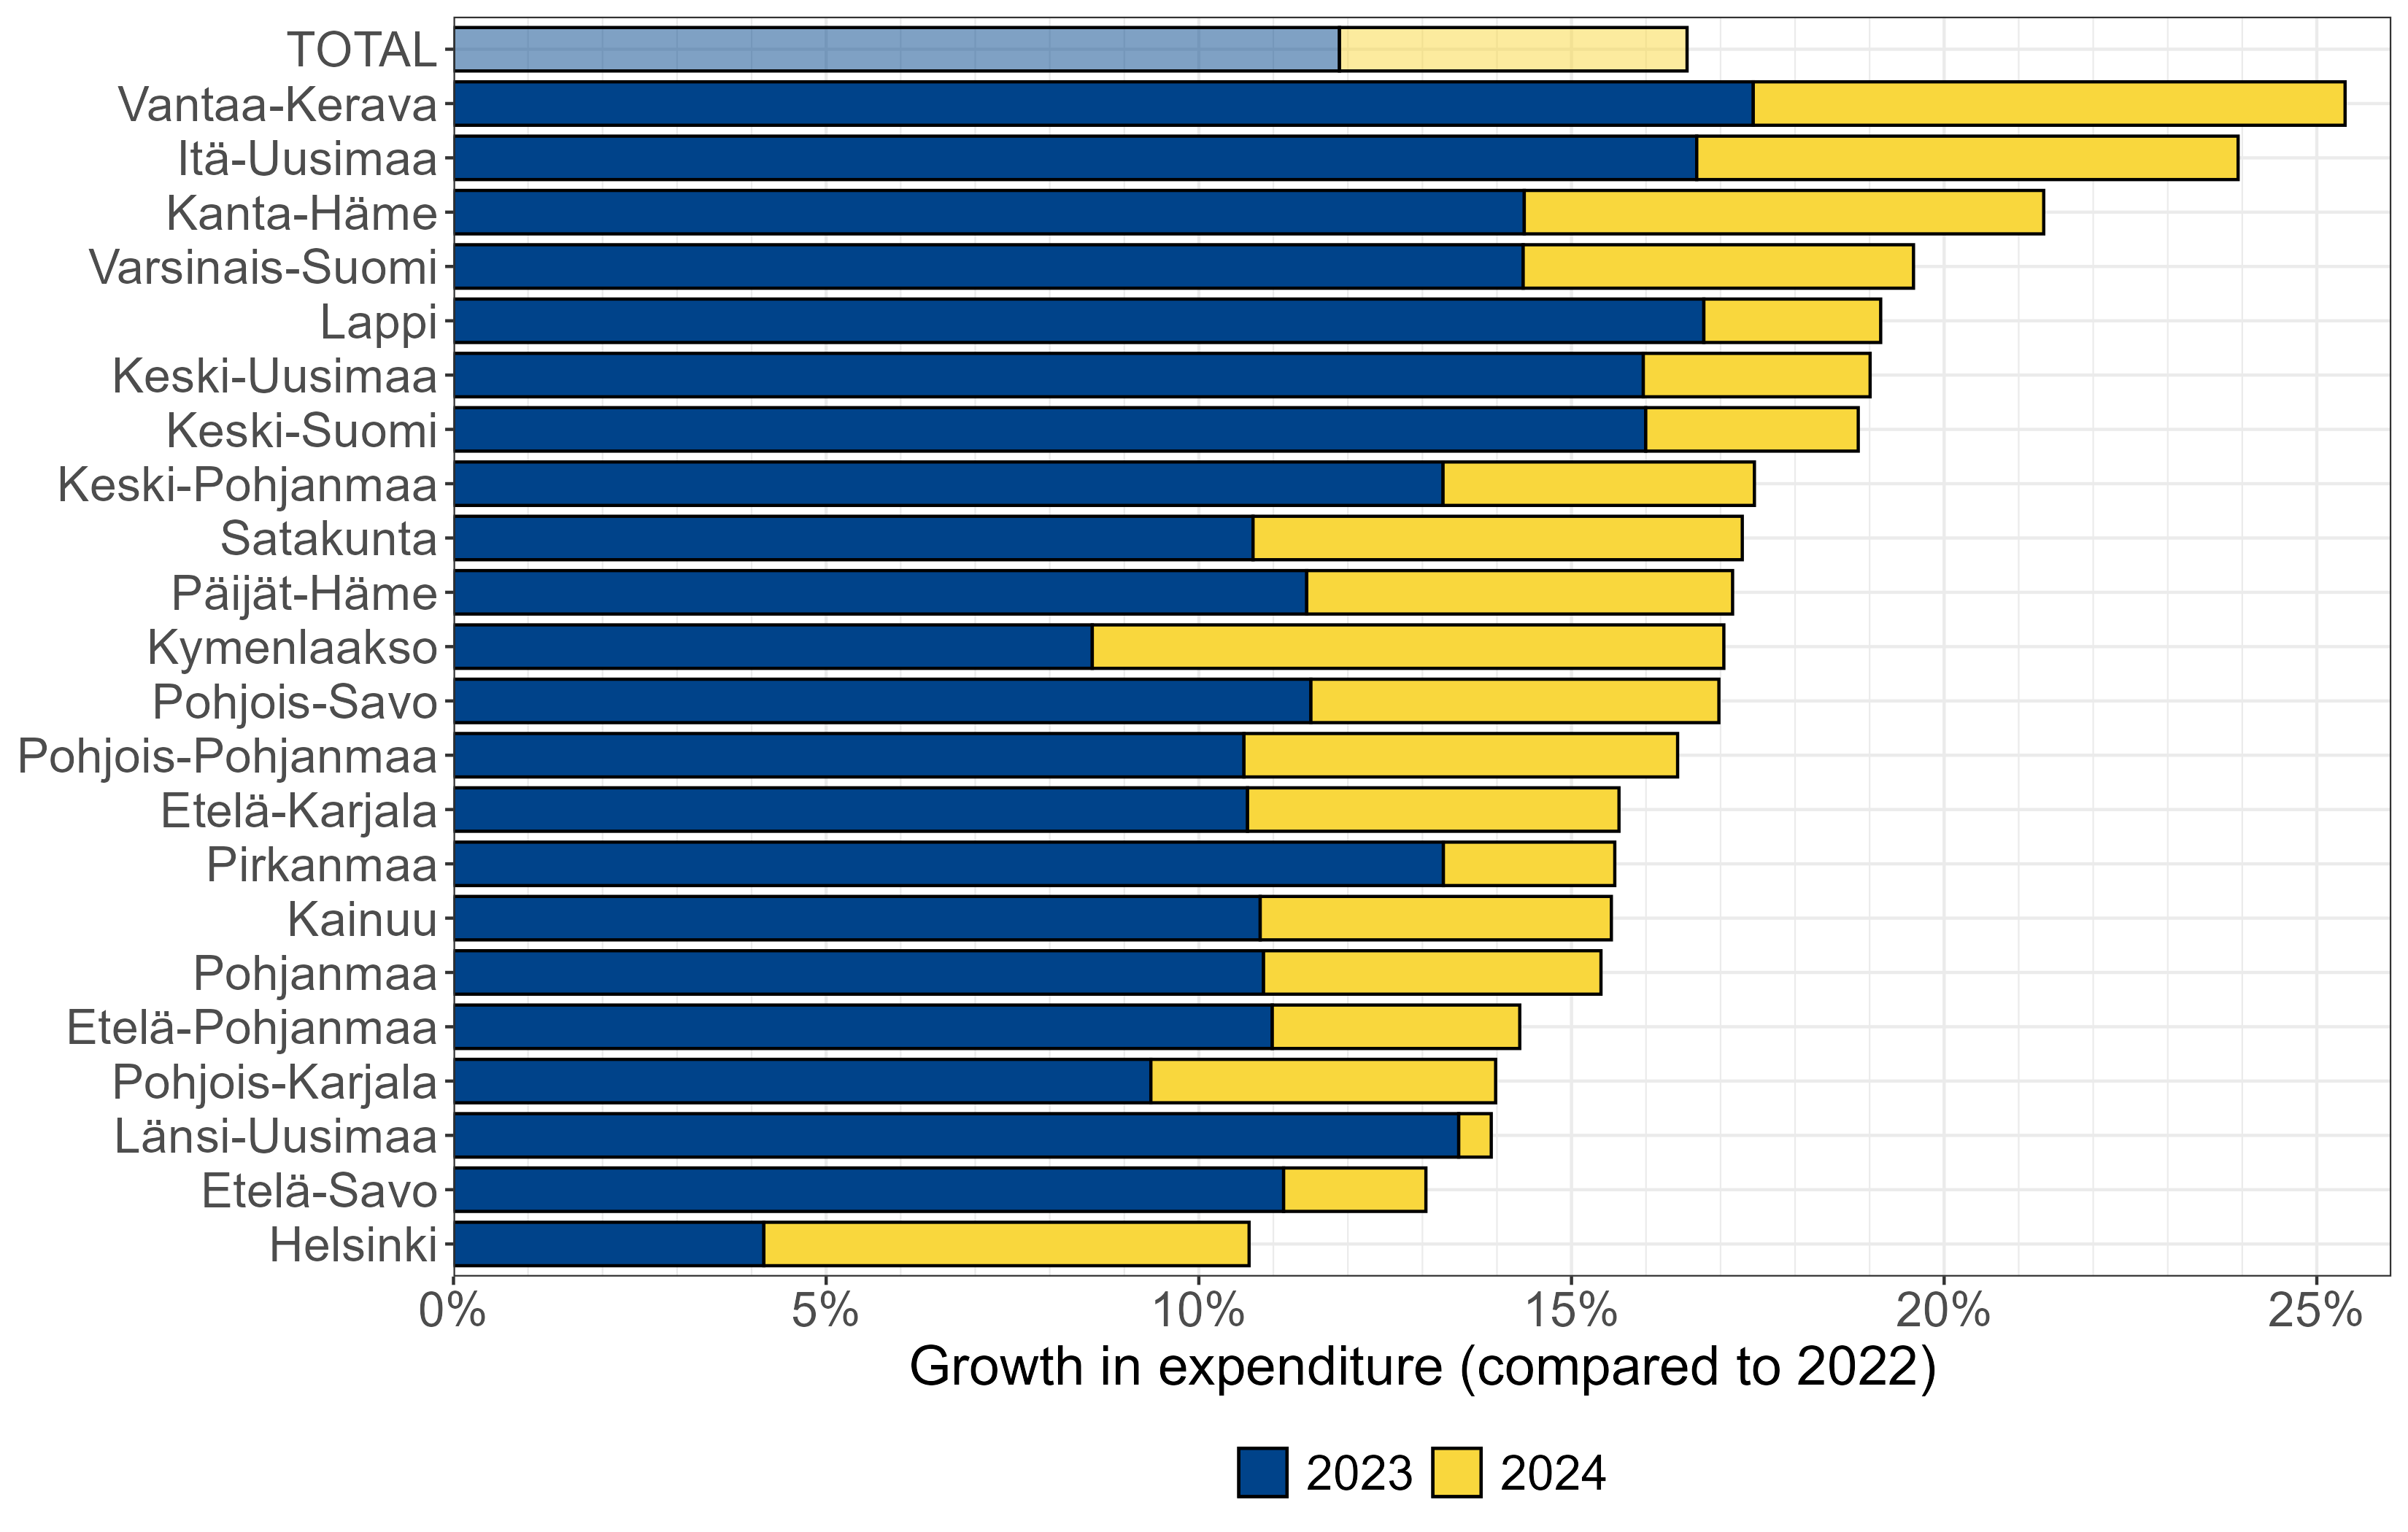
As discussed above, expenditure at the national level increased by in 2023 compared to what the municipalities spent on equivalent services in 2022. There were large differences in expenditure growth between the WSCs: expenditure grew by in Helsinki, while it grew by in Vantaa-Kerava, Itä-Uusimaa and Lappi.
According to the WSCs’ 2024 projections, expenditure growth slowed down in almost all of the counties in 2024. At the national level, expenditure growth is estimated to be approximately in 2024, but there are several counties where expenditure growth was projected to be slower. Figure 3.3.1 shows the growth in expenditure in 2023 (blue bars) and in 2024 (yellow bars) compared to the level of expenditure in 2022 in all wellbeing services counties.
Sources: State Treasury and Ministry of Finance.
It can be seen that the expenditure in Vantaa-Kerava in 2024 is more than higher than what Vantaa and Kerava spent as municipalities in 2022. At the same time, expenditure has increased by in Helsinki.
The reasons for the rapid expenditure growth at the national level, in particular the impact of the wage agreement and high inflation, apply more or less to all counties. At the beginning of 2023, there were large differences in the degree of service and ICT systems integration and in wage harmonisation between the counties. These caused a varying amount of start-up costs, and explain at least part of the variation in expenditure growth. Also, the costs in the reference year 2022 may have been incorrectly understated for some counties, resulting in high expenditure growth in 2023.
However, regardless of the reasons for the high cost growth, counties face the same obligation to balance their finances by the end of 2026.
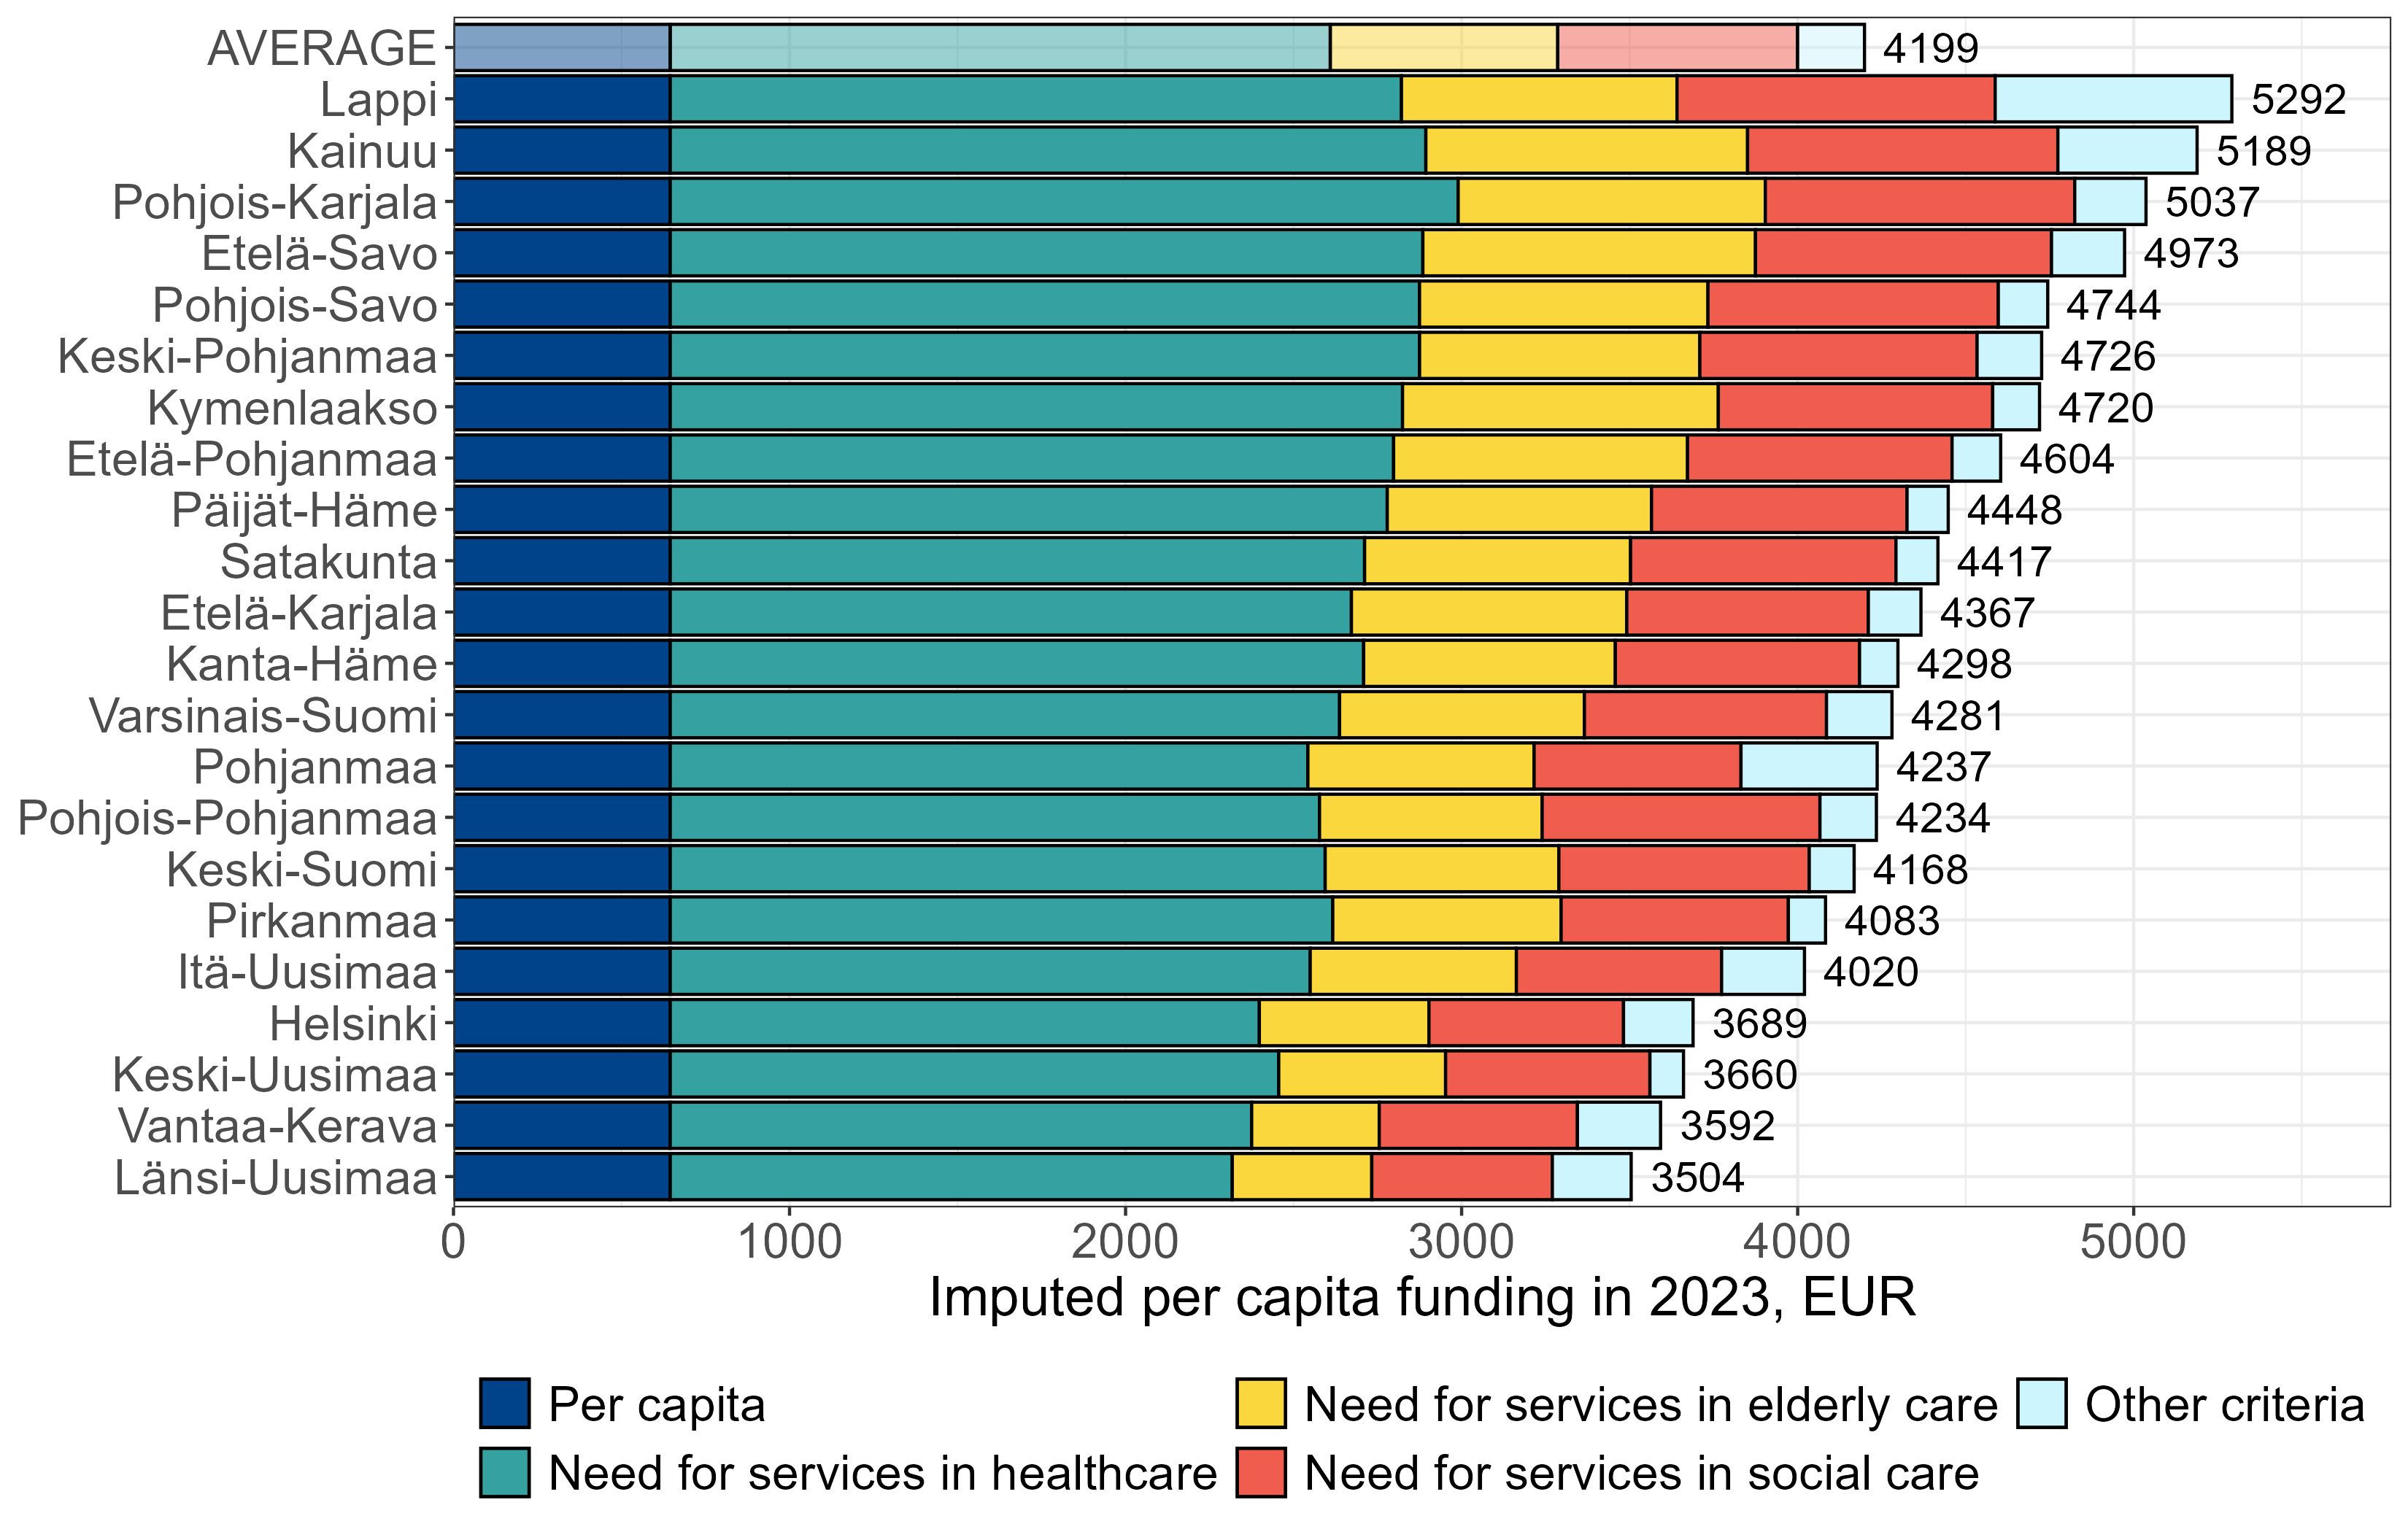
Central government funding of EUR 23.2 billion for 2023 amounted to EUR 4200 per capita. The largest share of the funding, EUR 2.6 billion, was allocated to Helsinki, and the smallest share, EUR 0.3 billion, was allocated to Keski-Pohjanmaa.
The allocation of funding across counties is based on the imputed criteria from the first year 2023. The imputed funding is intended to reflect the cost of providing statutory services due to differences especially in population structure, morbidity and socio-economic factors, but also in the languages spoken in the county and the population density. Due to this allocation mechanism, there is a large variation in per capita funding between the counties.
Figure 3.3.2 shows per capita funding in each county in 2023 divided into different criteria. Imputed per capita funding is highest in the counties of Northern and Eastern Finland, and lowest in the counties of Southern Finland. The highest per capita funding in 2023 was in Lappi, EUR 5300, and the lowest in Länsi-Uusimaa, EUR 3500.
Source: Ministry of Finance.
However, the difference between the imputed funding and the municipalities’ expenditure on social, and health and rescue services is somewhat significant for some of the counties. Therefore, in order to smooth the transition from the municipal system to full central government funding, there is a separate addition to or subtraction from the imputed funding for each county based on a county-specific transitional equalisation (not shown in Figure 3.3.2).
The equalisations are calculated as the difference between the imputed funding in each county in 2022 and the total net expenditure by the municipalities in each county in 2022. This difference is added to or subtracted from the imputed funding fully in 2023. The amount of the additions or subtractions are decreasing in a graded transition period until 2029, and they are not subject to the annual cost level revisions described in section 3.1. As the level of the imputed funding is adjusted annually to reflect changes in costs, the significance of the equalisations decreases over time.
In 2025, for 13 counties the additions or subtractions through the transitional equalisations are less than of their imputed funding. The largest subtraction in 2025 is for Pohjois-Karjala, with , or EUR 61 million (EUR 380 per capita) reduction to its funding. The largest addition is for Etelä-Savo, with , or EUR 37 million (EUR 280 per capita) addition. For Helsinki, too, the transitional equalisation is quite substantial, with or EUR 135 million (EUR 200 per capita) addition to its funding in 2025.
Above, Figure 3.3.2 shows how the funding is allocated across the counties in 2023. When assessing the economic outlook at county level, the increase in funding in each county is also of importance. As described in section 3.1, the national level of central government funding is adjusted annually according to the WSC price index and other revisions. These revisions are intended to ensure that funding is sufficient for the provision of services at the national level, while providing some cost control.
However, this adjustment in national funding is unevenly distributed. This is because the allocation of funding across counties is updated annually based on the latest population data and the revised county-specific coefficients for healthcare, elderly care and social care. The annual increase in funding for each county therefore reflects not only the cost level revisions, but also changes in their population, morbidity and socio-economic factors.
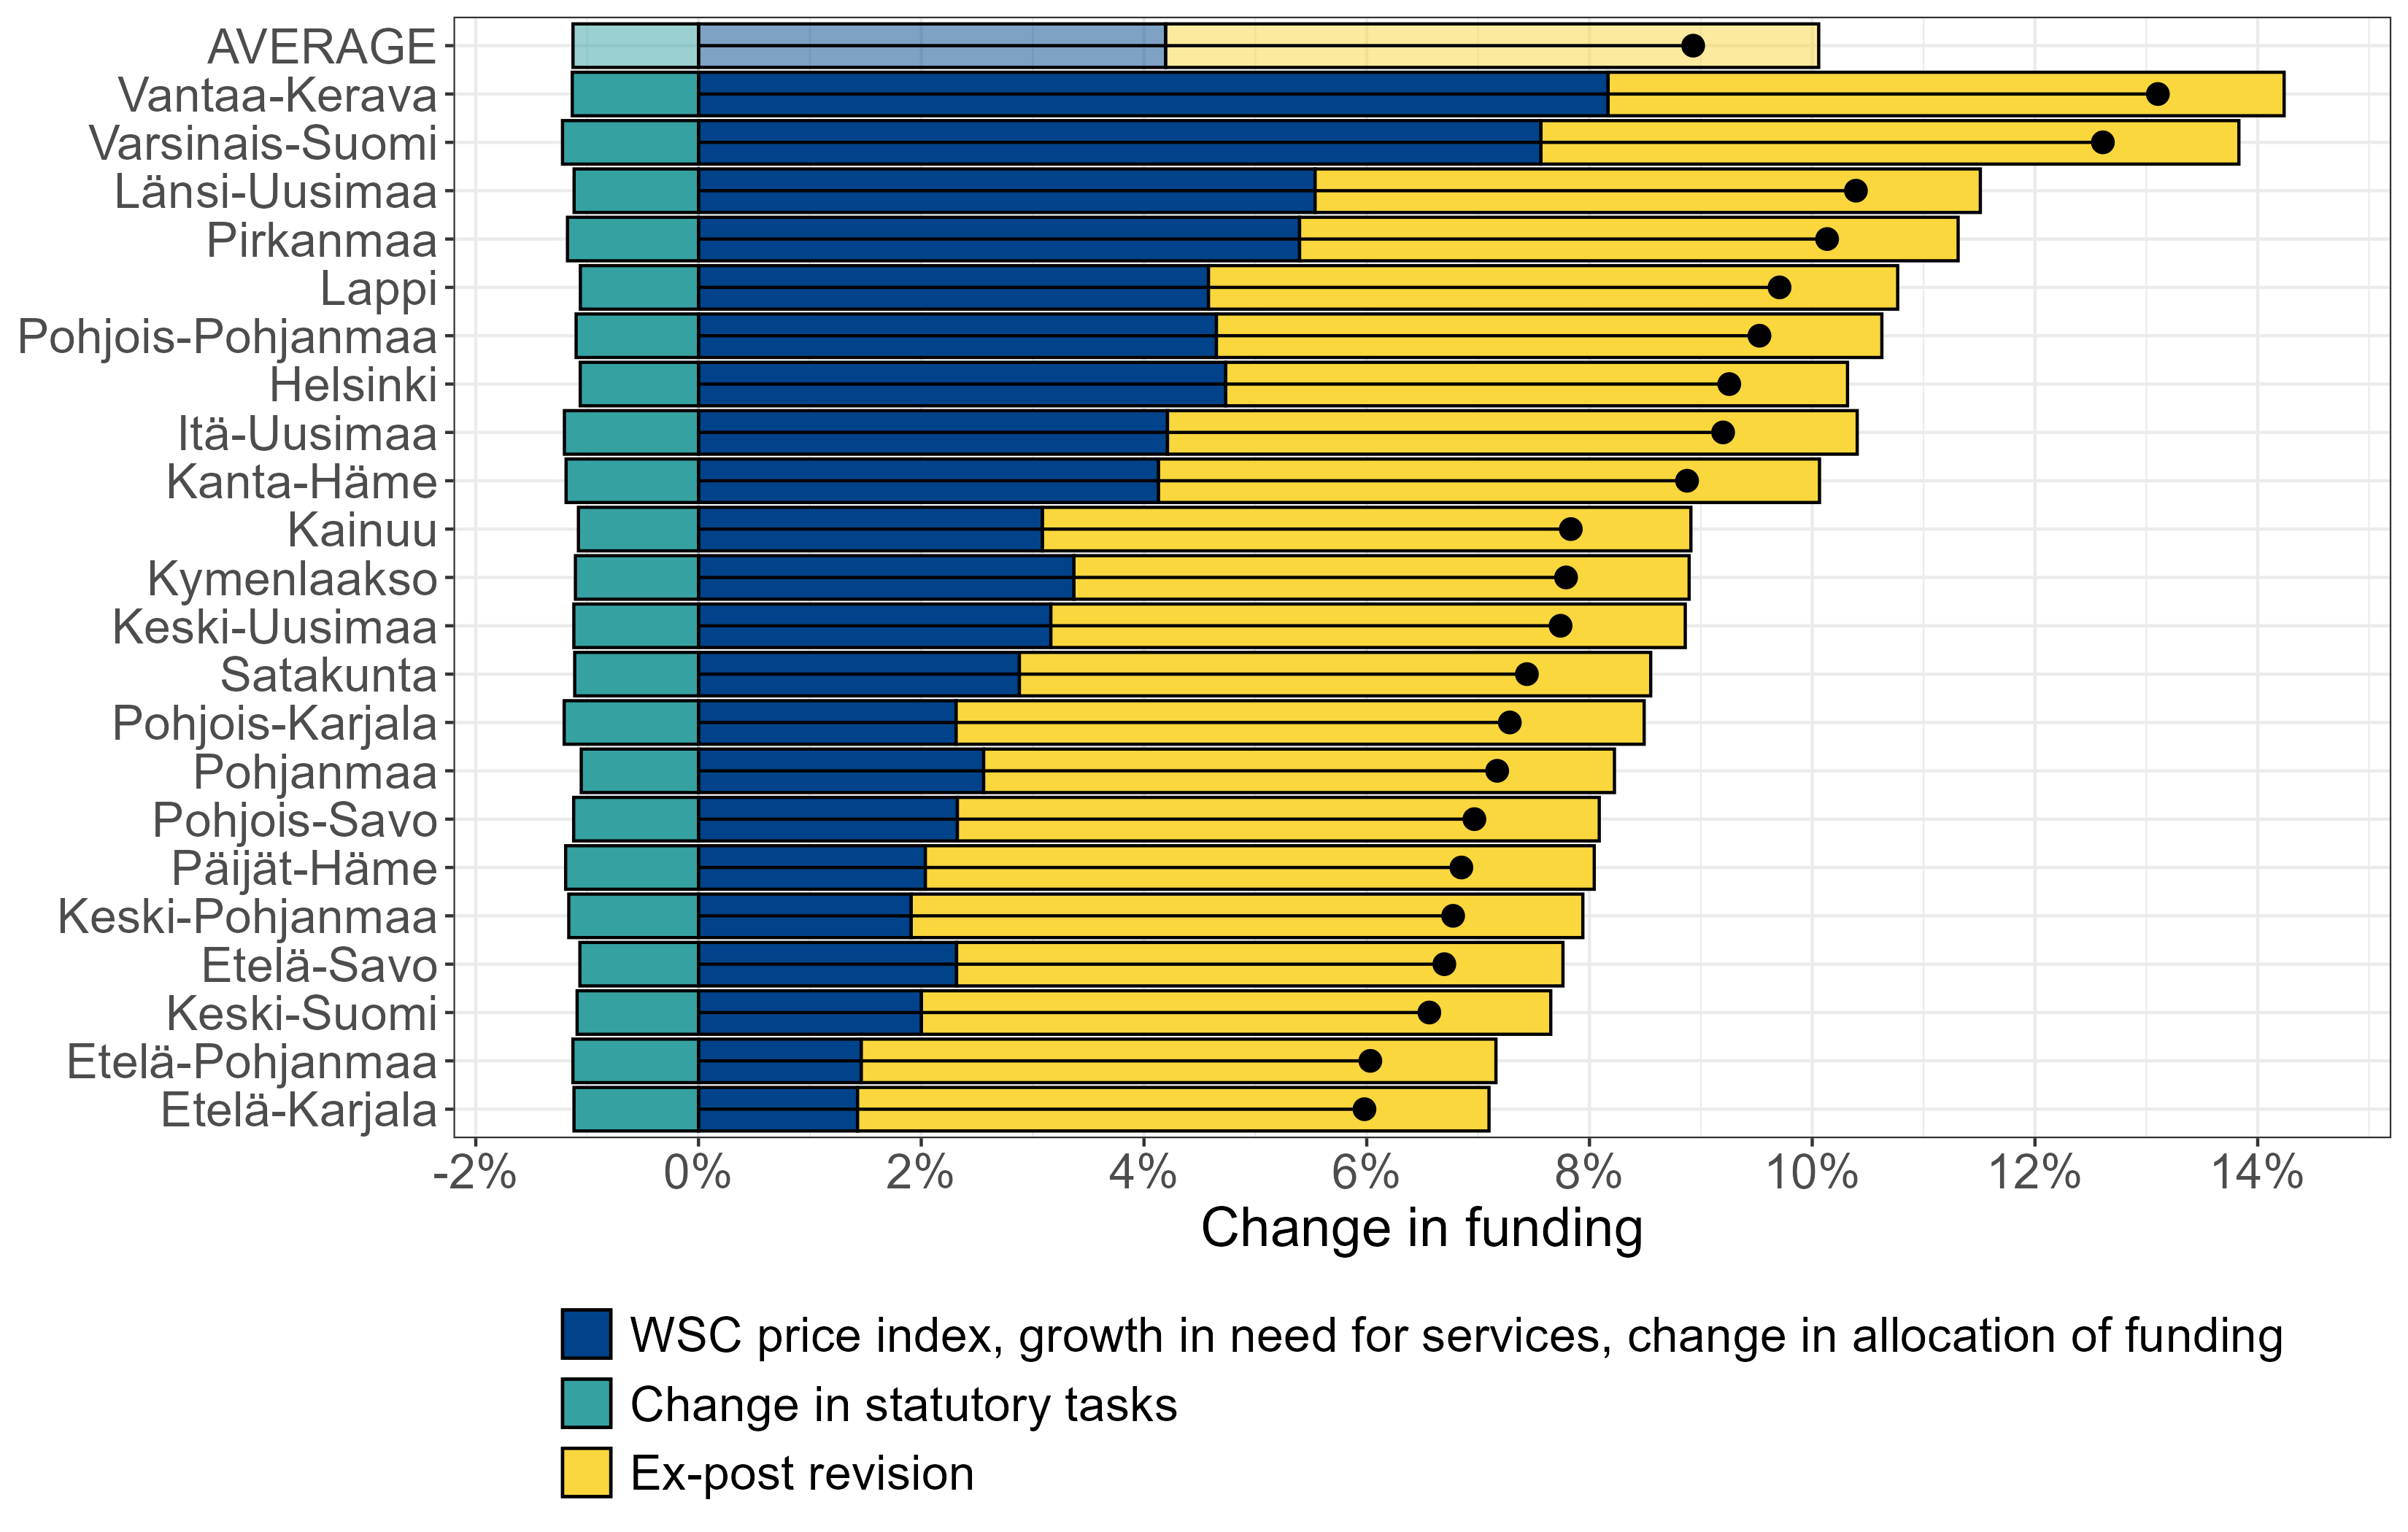
Figure 3.3.3 shows the uneven growth in funding in 2025 relative to 2024 in each county (black dots), which is largely due to the revision of allocation across the counties. In the figure, the growth is divided into three factors: i) the increase due to revisions by the WSC price index and growth in the need for services, and the impact of the revised allocation of funding between the counties (including the graded equalisations) (blue bars), ii) the change in funding due to changes in statutory tasks (green bars), and iii) the the ex-post revision (yellow bars).
Source: Ministry of Finance and Council’s calculations.
Taking into account all the annual revisions, the average increase in funding in 2025 is , ranging from in Etelä-Karjala to in Vantaa-Kerava. The blue bars in Figure 3.3.3 show the main reason for this variation. There is an average increase of in 2025 due to the ex-ante adjustments due to the WSC price index and the estimated growth in the need for services. This increase is allocated to each county based on the revised allocation of funding in 2025. As a result of this, funding grows by in Vantaa-Kerava, but only by in Etelä-Karjala.
According to the central government budget proposal for 2025, there is a reduction of EUR 270 million due to changes in the statutory tasks and requirements, meaning a reduction in funding on average. The first ex-post revision in 2025 increases funding by an average of .
For many of the counties in the bottom half of Figure 3.3.3, the increase in funding in 2025 is largely due to the ex-post revision, as the increase due to the WSC price index and growth in the need for services is largely offset by the reallocation of funding and reductions due to legislative changes.
As a result of the high expenditure growth, all counties except for Helsinki were in deficit in 2023. All counties including Helsinki are also projected to be in deficit in 2024. Grey bars in Figure 3.3.4 show the cumulative deficits in 2023 and 2024 in each county relative to the amount of their central government funding in 2023 and 2024. The cumulative deficit at the national level is of the total amount of funding in 2023 and 2024. The largest accumulated deficits, , are in Vantaa-Kerava and Itä-Uusimaa, while Helsinki is close to having a balanced economy in 2023-2024.
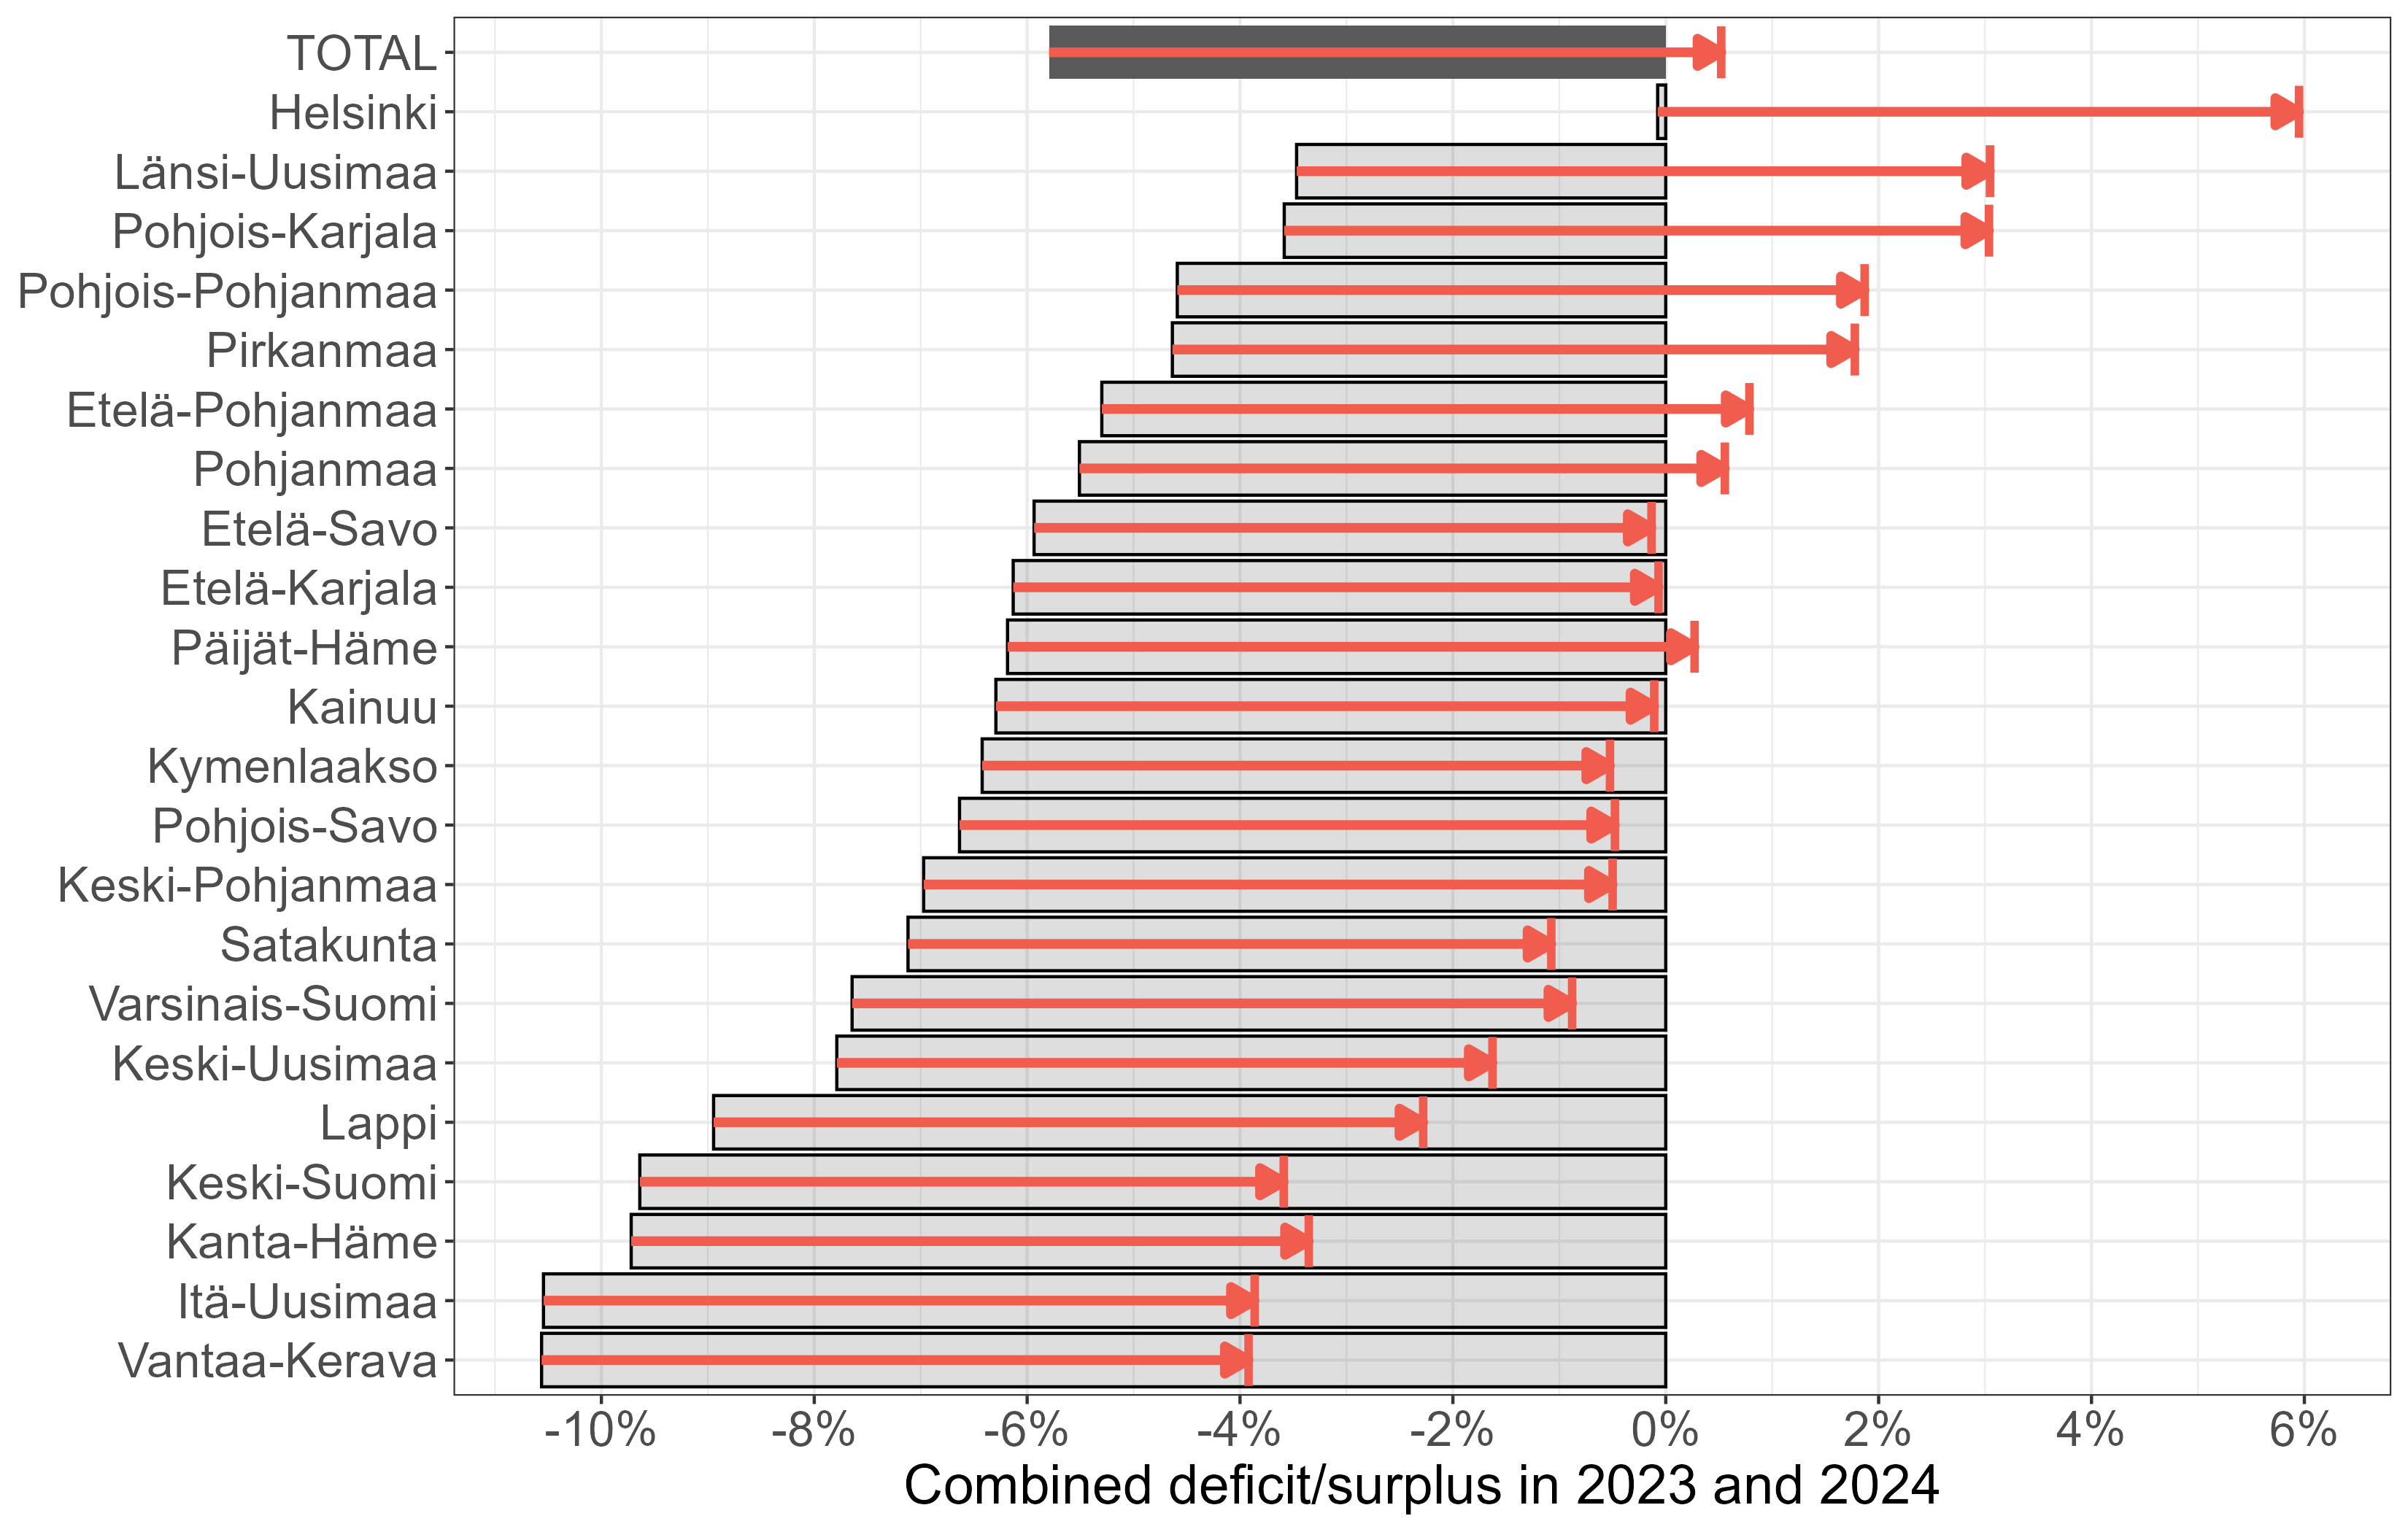
Sources: State Treasury, Ministry of Finance, and Council’s calculations. Notes: The red arrows indicate the amount of the cumulative deficit in 2023-2024 covered by the ex-post revision in 2025-2026.
At national level, the total amount of the ex-post revision in 2025 and 2026 corresponds to the deficits in 2023 and 2024, adjusted for cost revisions. It is allocated to individual counties in the same proportion as their imputed funding. The share of the ex-post revision in 2025 and 2026 allocated to each county is illustrated by the red arrows in Figure 3.3.4.11
The red arrows in the figure show how much of the cumulative deficit in 2023 and 2024 will be covered by the ex-post revision in 2025 and 2026 in each county. Due to the cost level adjustment, the ex-post revision slightly over-compensates the cumulative deficit at the national level.
As can be seen in Figure 3.3.4, there are eight counties for which the ex-post revision in 2025 and 2026 exceeds their cumulative deficits in 2023 and 2024. These counties will have their deficits covered or are even over-compensated by the ex-post revision. Even Helsinki that is close to having a balanced economy in 2023-2024, will have an ex-post revision of an estimated EUR 320 million in 2025-2026.
On the other hand, there are 14 counties with an accumulated deficit in 2023-2024 larger than their share of the ex-post revision in 2025-2026. In total, the accumulated deficit to be covered after accounting for the ex-post revision is approximately EUR 400 million.
It is important to recall that while the ex-post revision covers the accumulated deficits at the national level, it is not sufficient to generate the required surplus, as discussed above in relation to Figures 3.2.1 and 3.2.2. Significant spending cuts are also required. According to the example presented in Figure 3.2.2, the level of expenditure at the national level in 2026 should be approximately lower (in nominal terms) than in 2024 after taking into account the increase in funding due to the ex-post revision for there to be a sufficient surplus.
Compliance with the requirement to cover the accumulated deficits by the end of 2026 is assessed for each county, not for the WSCs as a whole. Therefore, it is important also to assess the variation in the required consolidation across counties. Many counties will have to cut their spending substantially more than in the example above to generate the required surplus. The amount of the required consolidation depends on how much of the cumulative deficit is uncovered after taking into account the ex-post revision, but also on how their central government funding grows in 2025 and 2026.
In Figure 3.3.5, the cumulative deficit in 2023-2024 after accounting for the ex-post revision in 2025-2026 in each county relative to their total funding in 2023-2024 is plotted on the horizontal axis. This represents the amount of the cumulative deficit that is remaining after taking into account the ex-post revision. The increase in funding in 2025 without the ex-post revision12 is plotted on the vertical axis. The red dashed line represents the average growth () in funding in 2025.
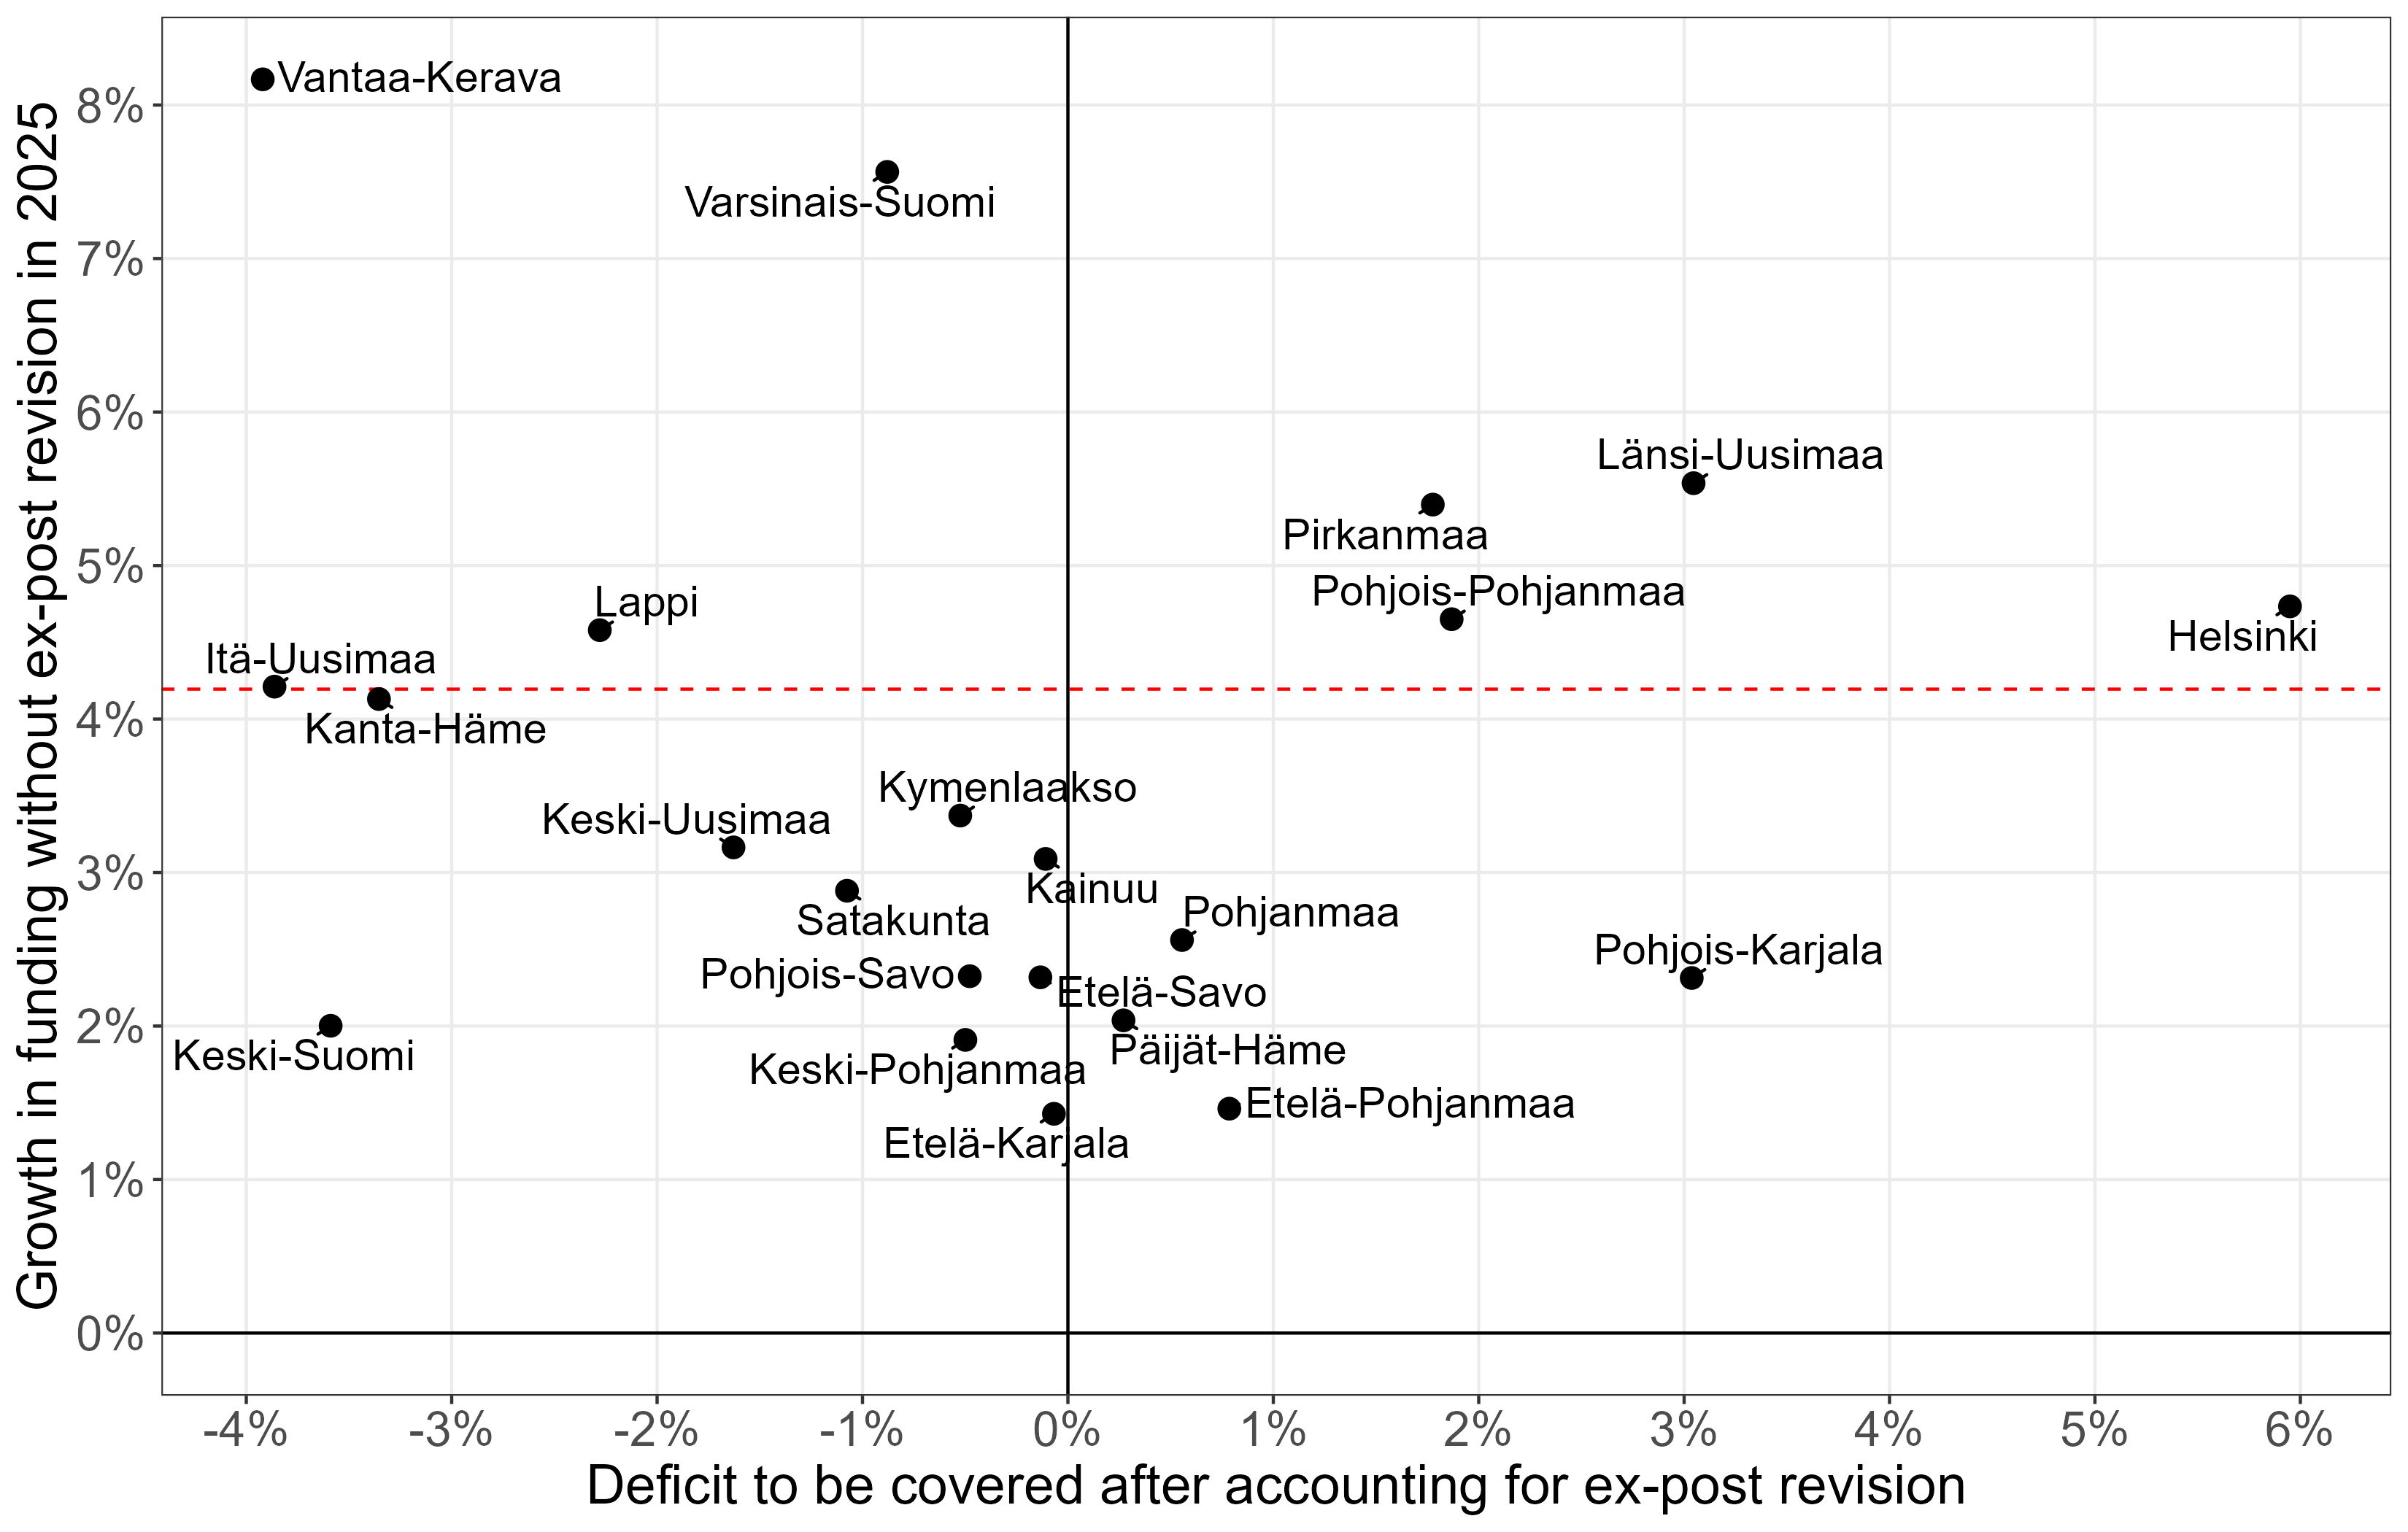
Sources: State Treasury, Ministry of Finance and Council’s calculations. Notes: Deficit on the horizontal axis is relative to cumulative funding in 2023-2024. Red dashed line represents average growth in funding.
The counties to the left of the mark on the horizontal axis in Figure 3.3.5 are those where the ex-post revision will not cover their accumulated deficits. The tightest financial framework is for the counties in the bottom left of the figure, as their funding grows less than the national average in 2025. These counties would need to make the largest cuts in spending in 2025 and 2026 in order to generate sufficient surplus to cover their deficits. The ex-post revision will not cover the deficits in counties in the top left of the figure, but their funding grows more than national average.
Of the counties on the left-hand side part of the figure, Vantaa-Kerava and Keski-Suomi are approximately the same size in terms of their budgets (EUR 1.2 billion) and the amount of the deficit to be covered after taking into account the ex-post revision (EUR 80 million). Funding without the ex-post revision grows by in Vantaa-Kerava, but only by in Keski-Suomi. In order to generate the required surplus, Keski-Suomi will have to reduce its expenditure substantially more than Vantaa-Kerava.
The ex-post revision over-compensates the accumulated deficits for counties to the right of the mark on the horizontal axis. Counties in the top right of the figure have their accumulated deficits covered by the ex-post revision, and their funding also increases more than the average. These counties face less or no consolidation pressure at all. It is worth noting these counties are the biggest ones in terms of their budgets and population. Of these, Helsinki is on its own level, meaning that it does not have the same consolidation timeline as the rest of the counties.
Here, we have discussed how the scale of the required consolidation varies across counties, depending on the amount of the accrued deficits and the funding outlook. At this stage, it is not possible to calculate the exact amount of consolidation required for each county, as the analysis has been based on the figures projected in August 2024, and funding for 2026 is based on a rough estimate by the Ministry of Finance. Once the final figures for the financial year 2024 are reported in spring 2025, and the funding for each county in 2026 is calculated by the Ministry of Finance, a more accurate assessment of the required spending cuts in each county can be made.
The built-in incentives in the funding model are working for most counties, as their financial frameworks are tight, forcing them to cut their costs. In practice, their ability to cut spending depends largely on whether rapid growth in expenditure has been due to one-off costs, or whether the costs are more permanent in nature. If the high costs can be largely explained by one-off start-up costs, it is more likely that these counties can cut their spending in 2025 and 2026. If the high costs are related more to permanent cost increases, then cost-cutting needs more drastic measures.
As mentioned above, there is approximately EUR 400 million of cumulative deficit in 2023 and 2024 that is not covered by the ex-post revision in 2025 and 2026. This further adds to the already significant consolidation pressure to generate sufficient surplus by the end of 2026, which requires that expenditure growth should be kept close to (or even slightly below) zero in nominal terms in 2025 and 2026. It is likely that not all counties manage to implement the required savings by the end of 2026, but need to continue their consolidation in 2027 too.
The ex-post revision is a statutory part of central government funding, and the government has set the central government spending limits based on a certain level of expenditure by the WSCs. The rapid expenditure growth in the WSCs therefore poses a challenge for the central government budget and for the sustainability of public finances as a whole.
The counties’ own consolidation measures are reflected in a lower level of central government funding through the ex-post revision with the two-year lag. If the WSCs succeed in reducing expenditure in 2025 and 2026, as shown in Figure 3.2.2, the level of funding in 2028 will be lower than in Figure 3.2.1, which shows projected expenditure growth without the counties’ own consolidation measures.
As the projected deficits in the WSCs in 2023 and 2024 have increased during this government term, the amount of funding for the WSCs has been adjusted in the central government spending limits decisions, first in autumn 2023 and again in spring 2024.
In the spring of 2024, the government reserved funding for the ex-post revision for the years 2025-2028 based on an estimate of realised expenditure in 2023 and on the projected expenditure in 2024–2026 that the counties had reported in their financial plans. According to the counties’ financial plans, the WSC finances would run a deficit of EUR 900 million in 2024, and would then turn into a surplus in 2025. The funding reserved on the basis of this projection (at 2025 prices) is EUR 1460 million in 2025, EUR 959 million in 2026, EUR 392 million in 2027 and EUR -131 million in 2028.
As counties have a legal obligation to prepare a financial plan that is balanced or in surplus, the financial plans were optimistic or even unrealistic for many counties. In order to be prepared for a higher trajectory of expenditure and thus to be able to cover a higher level of funding, the government decided in spring 2024 on an earmarked provision for the ex-post revision. The spending limits provision is EUR 35 million in 2025, EUR 437 million in 2026, EUR 924 million in 2027 and EUR 627 million in 2028. This earmarked provision cannot be used to finance any other spending than the ex-post revision.
Whether the funding reserved for the ex-post revision (including the earmarked provision) will be sufficient, especially in the last two years of the government’s term, 2026 and 2027, will depend on how the counties manage to curb expenditure growth in 2024 and 2025. As discussed above, the deficit in 2024 is approximately EUR 1.4 billion euros according to the counties’ own projections (as of August 2024). This is EUR 550 million higher than the estimated deficit in their budget plans for 2024. This means that the funding allocated to the ex-post revision for 2026 will not be sufficient, and also that the spending limits provision for 2026 will be exceeded by approximately EUR 150 million.
To cover this shortfall, the government will have to use the unallocated reserve within the spending limits or find either direct savings from the WSCs or elsewhere in the central government budget within the spending limits. If the actual deficit in 2024 surpasses the estimate made in autumn 2024, the spending limits will be breached more, and the government will have to find even more compensating savings elsewhere.
The sufficiency of the ex-post funding reserved for 2027 will depend on the final outcome of the financial year 2025. According to our calculations, expenditure growth at the national level would need to slow to around in 2025 for the funding reserved in the spending limits (including the earmarked provision) to be sufficient in 2027. This corresponds to a total consolidation of EUR 500 million in 2025 compared to the projected expenditure growth in the MoF autumn 2024 forecast.
As discussed above, the obligation to cover the accumulated deficit by the end of 2026 would require expenditure growth at the national level to slow to closer to zero or even be negative. Thus the obligation to cover the accumulated deficit imposes a stricter adjustment requirement than the sufficiency of the spending limits.
The government has proposed several measures to slow growth in expenditure in the wellbeing services counties. According to Annex B of the government programme, a total of EUR 1.3 billion of the consolidation in public finances is allocated to the social and health care sector by the end of the government term in 2027. In spring 2024, the government decided on a package of additional measures worth EUR 470 million by 2027.
The measures can be categorised into three ways in which they are expected to strengthen the public finances: i) wellbeing services counties’ own savings and productivity-increasing measures, ii) legislative changes in social and health care services with corresponding cuts in central government funding, and iii) cuts in central government funding without legislative changes in social and health care services. Each of these ways is discussed in more detail in the following.
First, approximately EUR 900 million of the planned consolidation is based on savings and productivity-increasing measures by the counties. In practice, this means that the counties would curb the growth in expenditure by means of their own measures. If the counties manage to curb the expenditure growth as projected in the government programme, the WSCs’ finances are expected to strengthen gradually in 2025-2027.
At this point, it is unclear what the exact impact of the counties’ own measures on the public finances will be. On the other hand, the counties have implemented productivity-enhancing measures and direct savings, but the wage agreement in the health and social care sector is still affecting their costs. Therefore, assessing these productivity increasing measures is not so straightforward.
Second, the government has decided on a set of legislative changes that reduce the range of statutory service provision and relax some of the personnel requirements. As described in section 3.1, reductions in the statutory tasks and obligations are cut from funding according to the estimated reduction in costs at the national level. Funding cuts are allocated to each county based on imputed funding - not one-to-one with actual cost reductions in each county.
The cuts to funding announced in the government programme amount to a total of EUR 440 million in 2027. A set of additional cuts of EUR 470 million by 2027 were decided in spring 2024. Some of the cuts are discussed below.
The government has decided to lower some of the personnel requirements decided by the previous government. These changes should help the counties to curb the growth in expenditure, but also help them to deal with the shortage of qualified staff in the health and social care sector.
In the government programme, it was decided that the requirement for minimum staffing in elderly care was to be maintained at the level in force when the current government took office, and the previous government’s decision to increase the requirement was postponed until 2028. The requirements regarding qualified staff in elderly care were also relaxed to help recruitment. In spring 2024, to achieve additional savings, the government decided to first lower the minimum staffing requirement in elderly care from 2025, and to cancel the planned increase altogether.
The government has also made decisions regarding the maximum waiting times for access to primary health care. In the government programme it was decided to maintain the maximum waiting time at 14 days, and the decision by the previous government to shorten it to seven days was cancelled. In spring 2024, the government decided to increase the maximum waiting time to 3 months in primary health care and from 4 months to 6 months in oral health care.
The savings associated with these changes, first to cancel the plan to shorten the maximum waiting time to 7 days, and then to further extend it to 3 months, are largely based on reversing the funding increases of the previous government. The previous government’s decision to shorten the maximum waiting time was estimated to lead to a permanent cost increase in primary and oral health care, for example through the need to recruit more staff. Based on the estimated cost increase, central government funding was increased correspondingly.
According to the government proposal (134/2024), estimating the actual savings of these changes is difficult. Some of the changes by the previous government were already implemented in 2023 with corresponding increases in funding. Since the central government funding is universal, it is difficult to detect how much of the funding was used to cater for the stricter requirement, especially with the WSCs running significant deficits in 2023. Also, it is not clear how extending the waiting times to care will help make savings, especially in the longer term. It is possible that this change will increase the use of emergency services, and therefore end up increasing costs instead of reducing them. Also, this change is in contrast with the reform’s aim of facilitating access to primary health care.
The government also decided to increase the client fees the counties can collect. The maximum client fees in primary health care will be and in specialised health care higher in 2025 (Decree 543/2024). To ensure this is a cost-saving measure for central government, the funding model is changed so that legislative changes in client fees will be taken into account in the level of central government funding in advance (HE 70/2024).
The government has also proposed several changes to the range of social and health care services the wellbeing services counties are required to provide, with corresponding cuts in funding.
The third way to curb cost growth is through direct cuts in central government funding without corresponding changes in statutory tasks. According to the government programme, there will be a direct cut of EUR 65 million in funding in 2027. This proposed cut is relatively moderate. The direct cuts in funding without corresponding changes in statutory tasks will strengthen the public finances only if the counties can adjust their provision of services to the lower level of funding.
The rapid growth in spending by the wellbeing services counties significantly hampers the government’s goal of stabilising the public debt-to-GDP ratio by the end of the parliamentary term and may make it difficult to adhere to the previously agreed spending limits in central government finances.
The cost increases, and also the 2023 and 2024 deficits in the counties, are largely driven by factors unrelated to the health and social services reform, such as a surge in inflation in 2022 and 2023 and the strong bargaining position of doctors in the labour market. On the other hand, the wellbeing services counties have had little time to implement productivity-enhancing reforms. For these reasons, the rapid growth in costs should not be seen as evidence of the failure of the health and social services reform.
However, there are reasons to question whether the current funding model is functioning optimally. Many wellbeing services counties have incurred large deficits during their first two years of operation. They are required to offset these deficits with corresponding surpluses by the end of 2026. This requirement means that many counties should try to reduce their spending significantly in 2025 and 2026. However, if they achieve this, they may find themselves in a position to substantially increase spending in 2027 compared to the preceding years. From the perspective of safeguarding key services, it would be preferable if counties could avoid some of the immediate spending cuts by spreading expenditure adjustments over a longer period.
The government should consider providing this kind of additional flexibility at least on a temporary basis. Importantly, this need not entail an increase in long-term central government funding. The funding model may also require permanent changes to the rules governing the timeframe for balancing deficits.
The proper functioning of the funding model for the wellbeing services counties relies on central government funding accurately reflecting actual service needs across different counties. If funding diverges from service needs over time, some counties may struggle to provide essential services. Meanwhile, other counties may receive excess funding that most of their residents would prefer to see redirected to other services or used to finance tax cuts, but the current funding model does not allow for such flexibility. On the other hand, reducing the funding of individual counties on the basis that they appear to be able to balance revenues and expenditure without difficulty would undermine their incentives to improve cost-efficiency.
The current funding model aims to align funding and service needs by accounting for factors such as age structure, morbidity, and various socio-economic differences. However, assessing service needs with precision is challenging. For example, occupational health services or private health insurance may cover varying proportions of service needs in different counties, even among those with similar employment rates. Furthermore, the relationship between observed characteristics and service needs may evolve over time. It is therefore important to try to assess regularly how accurately funding reflects actual service needs.
In order to generate savings, the government has, among other measures, lowered the minimum staff requirement in elderly care, extended the maximum waiting times for care, and increased the maximum client fees that the counties are allowed to charge. However, as these measures are tied to corresponding funding cuts, they do little to alleviate the financial difficulties faced by counties in providing essential services. Moreover, it is unclear how extending waiting times for care will lead to savings, especially in the longer term. This change also runs counter to one of the main aims of the health and social care reform, which was to improve access to primary health care.
A major challenge currently facing the wellbeing services counties is the difficulty and high cost of recruiting qualified staff. Counties are evidently compelled to compete for doctors by offering high salaries and particularly attractive working conditions. The scarcity of doctors may be the single most significant obstacle to ensuring the provision of adequate health care services. The government’s decision to increase reimbursements for private medical services may not alleviate the problem, as it could further strengthen the already strong position of doctors in the labour market by increasing the demand for doctors in the private sector.
To alleviate the situation, it is important to continuously seek opportunities to reallocate doctors’ time towards tasks where their expertise is most critical to health and wellbeing. At the same time, it is important to increase the supply of doctors in the labour market. The fact that this is by nature a relatively slow process, underlines the importance of speeding up measures that support it. The government’s decision to increase the number of places in medical training is a step in the right direction. Another option could involve individual wellbeing services counties or the Ministry of Education financing medical training at foreign universities, provided the students commit to working for the counties for a set number of years upon graduation or repay the costs of their studies. The government should also consider reviewing the language requirements to increase the number of migrant doctors in the labour market. Finland’s growing immigrant population would benefit from access to a broader range of languages, and it is likely that many Finns could communicate effectively with a doctor who does not have perfect command of Finnish or Swedish.
This chapter examines the government’s fiscal policy and the outlook for public finances. We begin by reviewing the implementation of the consolidation measures outlined in the government programme, followed by a summary of the key fiscal policy decisions made in spring 2024 to strengthen public finances. We then analyse the distributional impact of these decisions, with a focus on the government’s decision to increase value-added taxation. Next, we assess the outlook for public finances and explore underlying trends in government expenditure over the past two decades to provide context for the current fiscal situation. Finally, we evaluate how well the government’s fiscal policy plan aligns with the new EU fiscal rules, assess the fiscal stance, and comment on the government’s climate policy.
According to Prime Minister Orpo’s government programme (Finnish Government, 2023), the government aims to stabilise the debt-to-GDP ratio and limit the general government deficit to no more than 1% of GDP by the end of its term. To achieve these goals, the government announced a EUR 6 billion consolidation package, with approximately EUR 4 billion to be achieved through savings in public spending. These savings are expected to come mainly from cuts in social benefits, reductions in certain health and social services, and productivity improvements in social services and public administration. The remaining EUR 2 billion relies on higher employment through improved labour supply incentives.
The government announced a new set of measures worth EUR 3 billion in its spring 2024 spending limits session. This brings the total consolidation target to EUR 9 billion by 2027. Here we describe the implementation of the most significant measures outlined in the government programme, along with the additional measures introduced in spring 2024. We do not discuss the potential employment effects here; see our previous report (EPC, 2024) for a detailed discussion of the estimated employment effects and the methods behind the estimates. (Section 4.3 explains how the Ministry of Finance has incorporated these measures into its latest economic forecast.) We also do not examine the tax changes included in the government programme, as they consist of both tax increases and tax cuts, which are not expected to have a large net impact on total tax revenues.
Social benefits
A total of EUR 1.2 billion of the measures announced in the government programme is based on cuts to social benefits. Many of these cuts relate to unemployment benefits. The measures listed in the government programme and their estimated annual impact on public finances include e.g. grading of earnings-related unemployment benefit (EUR 175 million), abolishing age-related exceptions to unemployment security (EUR 103 million), abolishing child increments (EUR 70 million), and extending the prior work requirement for unemployment security to 12 months (EUR 66 million).
The government has implemented these changes with three sets of legislation (HE 8/2024, HE 13/2024 and HE 73/2023), coming into force in 2024 and 2025. According to the estimates presented in the government proposals, the impact of the changes in unemployment benefits directly strengthens public finances by about EUR 560 million. They are also expected to indirectly strengthen public finances through higher employment, driven by improved labour supply incentives.
The government has also already implemented cuts in housing allowances. The legislation (HE74/2023) entered into force as of 1 April 2024. Taking into account both the direct savings from the reduction in housing benefits and the resulting increase in social assistance expenses, the reform is expected to strengthen public finances by EUR 300 million from 2025.
An additional reduction in social benefits is being implemented through index freezes. The government decided to freeze index increases linked to the national pension index or the consumer price index for all social benefits (excluding pensions, social assistance, and certain other benefits) until the end of its term in 2027. This measure is projected to save EUR 387 million by 2027.
Social and health care services
Approximately EUR 1.3 billion of the total consolidation target in the government’s programme is allocated to social and health care services. Of this, EUR 900 million is expected to come from savings and productivity-enhancing measures - which are discussed below - and EUR 440 million is expected to be saved by 2027 by lowering certain quality standards in health and social care and by reducing the range of services that the wellbeing services counties are required to provide, along with corresponding cuts in central government funding to them.
In its programme, the government decided to postpone the previous government’s decision to increase the minimum staffing level in elderly care until 2028. Along with relaxing the qualifications required for staff in elderly care, these changes were estimated to cut funding by EUR 119 million starting from 2025. Additionally, the government decided to maintain the maximum waiting time for access to primary health care at 14 days, meaning a cut of EUR 30 million from 2025.
The government also decided to increase the maximum client fees that the wellbeing services counties can charge in health care, with a corresponding cut of EUR 50 million. Changes to the service network, i.e. to the national system of hospitals and the emergency health service, were estimated to save EUR 75 million from 2027. However, these estimated savings were revised downwards in spring 2024.
The measures announced in the government programme are gradually implemented during the government term. While some of the measures and the cuts associated with them have been revised downwards, some of the announced measures were extended in spring 2024.
Productivity-increasing measures
The government also aims to strengthen public finances by increasing productivity in the public sector. According to the government programme, savings of EUR 240 million are expected from the implementation of productivity programmes in central government administration. Approximately EUR 900 million of the planned consolidation is expected to come from productivity-enhancing measures in the wellbeing services counties.
While the government is likely to achieve expenditure savings in public administration, tracking the realisation of savings associated with productivity-enhancing measures in the wellbeing services counties is likely to be very difficult, if not impossible.
Social benefits
The new measures, announced in 2024, include additional cuts to unemployment benefits, which are expected to strengthen public finances by approximately EUR 25 million (HE135/2024 on withdrawal of active-period increase elements in unemployment security). The government has also implemented changes to the pensioners’ housing allowance (HE 126/2024), which had previously been left intact (apart from the index freeze) despite cuts to the general housing allowance. These changes adjust the income limits for the pensioners when assessing the eligibility for housing allowance, and is estimated to strengthen public finances by EUR 25 million from 2026 onwards.
A large part of the cuts to unemployment benefits that were announced in the government programme will be implemented gradually in 2024 and 2025. These cuts are expected to reduce the expenditure of the Employment Fund, one of the social security funds, allowing for a reduction in unemployment insurance contributions for both employees and employers. To ensure that these cuts lead to improved public finances rather than lower social security contributions, the government has linked (HE 123/2024) the reduction in unemployment insurance contributions to an increase in health insurance contributions for employees and employers, coupled with a reduced share of central government funding for health insurance.
The government has also adjusted the sickness allowance scheme and increased the out-of-pocket share for medicinal products. These two measures are estimated to strengthen public finances by EUR 80 million from 2026.
Social and health care services
In its spring 2024 spending limits decision, the government also introduced additional cuts to social and health care services totalling EUR 350 million in 2025 and gradually increasing to EUR 470 million in 2027. These savings are to be achieved by extending some of the measures listed in the government programme, and by further reducing the range of health and social services that the wellbeing services counties are required to provide. The government decided to lower the minimum staffing requirement in elderly care and to cancel the increase that was due to take effect in 2028. This adjustment has been implemented (HE 127/2024), and will cut funding by EUR 45 million from 2025.
The maximum waiting times for access to primary health care have been extended from 14 days to 3 months and for oral health care from 4 months to 6 months. During the budget negotiations for 2025, it was decided that children and young people under the age of 23 would be excluded from this extension of maximum waiting times. This change has been implemented (HE 134/2024), and cuts funding by EUR 95 million from 2025.
The government also decided to reduce central government funding to wellbeing services counties by increasing client fees by a further EUR 100 million from 2025. Total cuts to funding due to increases in client fees amount to EUR 150 million from 2025. The government also decided to make further cuts to the range of social services, with cuts to funding of EUR 100 million from 2026, and to the range of specialised health care services, with cuts to funding gradually increasing to EUR 70 million by 2028.
Adding up all the savings announced in the government programme, and the additional cuts decided in spring 2024, the planned savings amount to approximately EUR 590 million in 2025, and gradually increasing to EUR 910 million in 2027. However, some of these cuts have been postponed or the estimated savings have been revised downwards. Although the government has decided on compensatory savings, the total savings amount to approximately EUR 500 million in 2025.
Tax increases
In terms of fiscal impact, the most important decision taken by the government in spring 2024 was to increase the general VAT rate by 1.5 percentage points. This increase was implemented in September 2024 and is estimated to increase central government revenues by EUR 1.1 billion in 2025. We discuss this measure further below.
The VAT rate on most products and services that are currently subject to a reduced VAT rate of 10% was increased to 14%, with an estimated increase in tax revenue of EUR 205 million euros in 2025 (HE 141/2024). This change applies from the beginning of 2025. Additionally, the reduced VAT rate of 14% on confectionery will be increased to the new general VAT rate of 25.5%, generating an estimated tax revenue increase of EUR 40 million in 2025 and EUR 80 million from 2026. This change is due to be implemented in June 2025.
The taxation of pension income was tightened by adjusting the pension income deduction, with a total estimated revenue increase for central and local government of EUR 150 million in 2025. The tax credit for household expenses (kotitalousvähennys) has also been reduced, with an estimated revenue increase for central government of EUR 100 million from 2025 onwards.
Other new measures
The government decided to increase the savings of the productivity programme for central government by EUR 150 million. The total savings amount to EUR 390 million by 2027.
As part of its new consolidation efforts, the government also aims to reduce the tasks of municipalities. These measures are expected to strengthen local government finances by EUR 75 million and central government finances by EUR 25 million. However, the government also decided to permanently increase central government grants to municipalities by EUR 277 million from 2025. This adjustment is intended to compensate for changes in municipal revenues following the social and health care reform.
Additionally, the government decided to reduce funding for vocational education by EUR 100 million. It also reduced funding for development aid by advancing cuts already outlined in the government programme and introducing new cuts, amounting to savings of EUR 95 million in 2025.
The government has implemented most of the direct cuts to social security benefits outlined in the government programme, either in 2024 or from the beginning of 2025. The programme also includes a freeze on the indexation of several social security benefits. This measure has also already been implemented. However, its impact on public spending will increase over time as inflation, combined with the freeze, erodes the real value of the benefits.
The consolidation programme described in the government programme is partly based on strengthening employment, mainly by improving work incentives through benefit cuts, and on improving the productivity of public services, especially in the wellbeing services counties. It is too early to assess the employment effects of the government’s measures. In any case, employment has fallen as a result of the economic downturn. Similarly, it is not possible at this stage to assess the success of the productivity-enhancing measures in the government programme.
In its spring 2024 spending limits session, the government decided on substantial new consolidation measures. Departing from the government programme, it also took decisions that significantly tighten taxation without offsetting tax cuts, and these measures have already been implemented. While there is some uncertainty about the extent to which the tax increases will translate into higher tax revenues, they are likely to be a more reliable means of rapidly strengthening public finances than structural reforms aimed at improving labour supply or productivity in the wellbeing services counties.
In addition to these consolidation measures, public finances during the government’s term will be shaped by underlying expenditure pressures related to population ageing, defence and R&D subsidies, which largely reflect decisions taken by previous governments.
Our previous annual report discussed in detail the distributional implications of the consolidation measures outlined in the government programme. We argued that certain cuts to social transfers were misaligned with the government’s stated goal of shielding the most vulnerable groups from the savings measures. As described in the previous section, many of these cuts have now been implemented. However, the full impact of the benefit freeze will take time to materialise.
Here, we discuss the distributional impact of some of the new consolidation measures introduced by the government in 2024. Our main focus is on the increase in the general VAT tax rate, as it is the single most significant measure in terms of fiscal impact. In addition, we briefly discuss the new savings measures in the area of health and social services.
It is often emphasised that high-income households consume a smaller share of their annual income than lower-income households, resulting in high-income households paying less in consumption taxes relative to their income. From this perspective, VAT and other consumption taxes appear regressive (see e.g., Riihelä and Tuomala (2022), Figure 1.6), raising concerns about the distributional impact of the VAT increase.
However, this is not the only way to assess the distributional impact of VAT or consumption taxes in general. Ideally, we might want to assess these effects by evaluating consumption taxes relative to lifetime income. While lifetime income may be difficult to measure, it seems clear that the tax burden of consumption taxes is much more evenly distributed when measured against lifetime rather than annual income. For instance, households at the top of the income distribution in a given year—perhaps because of a one-off bonus or a business sale—are likely to save a large proportion of their income and therefore pay lay little consumption taxes relative to their income. In subsequent years, as these savings are spent, they will pay more consumption taxes relative to income. Similarly, households currently at the lower end of the income distribution may later increase their savings, thereby reducing their VAT burden relative to annual income.
In the absence of reliable measures of lifetime income, the Mirrlees Review (Adam et al. (2011), chapter 2) recommends that consumption taxes are assessed relative to annual consumption. Assuming a uniform VAT rate (and uniform pass-through to the prices of different goods), the burden of VAT would be proportional to consumption across all income groups. From this perspective, the increase in the general VAT rate is neither regressive nor progressive.
A VAT increase effectively taxes labour by reducing real wages, but it also acts as a one-off wealth tax by reducing the real value of financial assets. This can be considered as efficient, as a one-off wealth tax does not distort incentives to work or save (Correia (2010)). It should alleviate distributional concerns, as financial wealth tends to correlate with high lifetime income.
The distributional impact of the VAT increase also depends on how social benefits are indexed. Many benefits are normally indexed to consumer prices, shielding low-income households from the impact of VAT hikes. However, the government has frozen the indexation of many social benefits until 2027, or until the consumer price level rises by 10.2% relative to 2023. This allows the real value of these benefits to erode over time. Given Finland’s current low inflation, the threshold is unlikely to be reached soon, so the VAT increase will reduce the real value of these benefits.
Pensions, however, are not subject to the index freeze. Retirees, many of whom are relatively well-off, are thus largely shielded from the VAT increase. Earnings-related pensions are indexed to consumer prices and to wages, while national pensions are fully indexed to prices. This also limits the extent to which the VAT increase strengthens public finances, as higher nominal pensions will eventually require higher pension contribution rates.
The government’s decision to slightly increase the taxation of pension income can be seen as an attempt to balance the impact of tax increases between retirees and working-age individuals. A more direct approach would be to exclude the impact of the VAT increase from the index used to adjust earnings-related pensions. Protecting relatively well-off pensioners from consumption tax increases designed to improve public finances seems difficult to justify.
In summary, the VAT increase does not appear to be particularly problematic from a distributional perspective. However, due to the indexation freeze, it effectively leads to a small reduction in the real value of certain social benefits that have already been cut by the current government and that are important for low-income individuals. Meanwhile, pensioners are largely insulated from the impact of the VAT increase.
The government has stated in its programme that it will pay particular attention to the most vulnerable groups when considering different savings measures. For these groups, the quality and availability of public health and social services is likely to be crucial. However, the financial challenges faced by the wellbeing service counties, outlined in the previous chapter, risk undermining these services.
A major issue for the wellbeing services counties is the difficulty and cost of recruiting sufficient qualified staff. In principle, the government’s recent decision to lower the minimum staffing requirement in elderly care could help to address this challenge. However, as this reduction in staffing requirements is accompanied by a corresponding reduction in funding from central government to the counties, it does not provide additional capacity to take on more patients.
More broadly, the government must carefully assess whether it is feasible for all wellbeing services counties to eliminate their accumulated deficits within the required timeframe without significantly compromising the quality and availability of essential services. As discussed in the previous chapter, the required adjustment is substantial for the most indebted counties.
General government deficits are forecast to remain in the coming years. The Ministry of Finance (2024b) forecasts that the general government budget balance will be of GDP in 2024 and of GDP in 2025. The deficits are forecast to decrease gradually, with the budget balance reaching of GDP by 2029. The Ministry of Finance (2024b) forecast for the deficit therefore exceeds the goal of at most deficit by 2027 in the government programme.
Figure 4.3.1 illustrates the development of the headline general government budget balance, broken down by sub-sector. The figure shows the realised development since 2006, and the MoF’s forecasts from 2024. Central government is projected to record the largest deficits, while the social security funds remain the only sub-sector with a positive balance, as pension funds continue to accumulate wealth. The municipalities and wellbeing services counties (WSCs) as a whole are forecast to run deficits throughout the period up to 2029.13 This pattern—characterised by central government deficits, pension fund surpluses, and sub-national government deficits—has broadly persisted since 2009.
Sources: Statistics Finland and Ministry of Finance (2024b).
The MoF forecast assumes that the government’s measures to boost employment will gradually improve employment from 2025, with about two thirds of the estimated long-term impact of 80,000 jobs being realised by the end of the government’s term. The assumption that these measures will increase employment only gradually is undoubtedly reasonable. Improvements in employment driven by increased labour supply require the creation of new jobs, which inevitably takes time. However, the precise timeline is impossible to predict. This adds to the already considerable uncertainty about the long-term effects of the government’s employment measures.
Persistent fiscal deficits are the result of public expenditure continuously being higher than revenue. In our last report (EPC, 2024), we noted that even without significant changes to tax policy in the government programme, taxes (and revenues) as a share of GDP were forecast to decline over the government’s term. In spring 2024, the government decided to increase VAT along with other measures that will increase government revenues in the coming years. The most recent Ministry of Finance (2024b) forecast no longer has this declining path for taxes. This is evident from Figure 4.3.2, which shows the realised and forecast general government expenditure, revenues, and taxes as a share of GDP. In the updated forecast, taxes as a share of GDP are expected to remain roughly at the levels where they were when the current government took office. Public expenditure as a share of GDP is instead forecast to decline after 2024 as consolidation measures on the expenditure side are increasingly implemented.
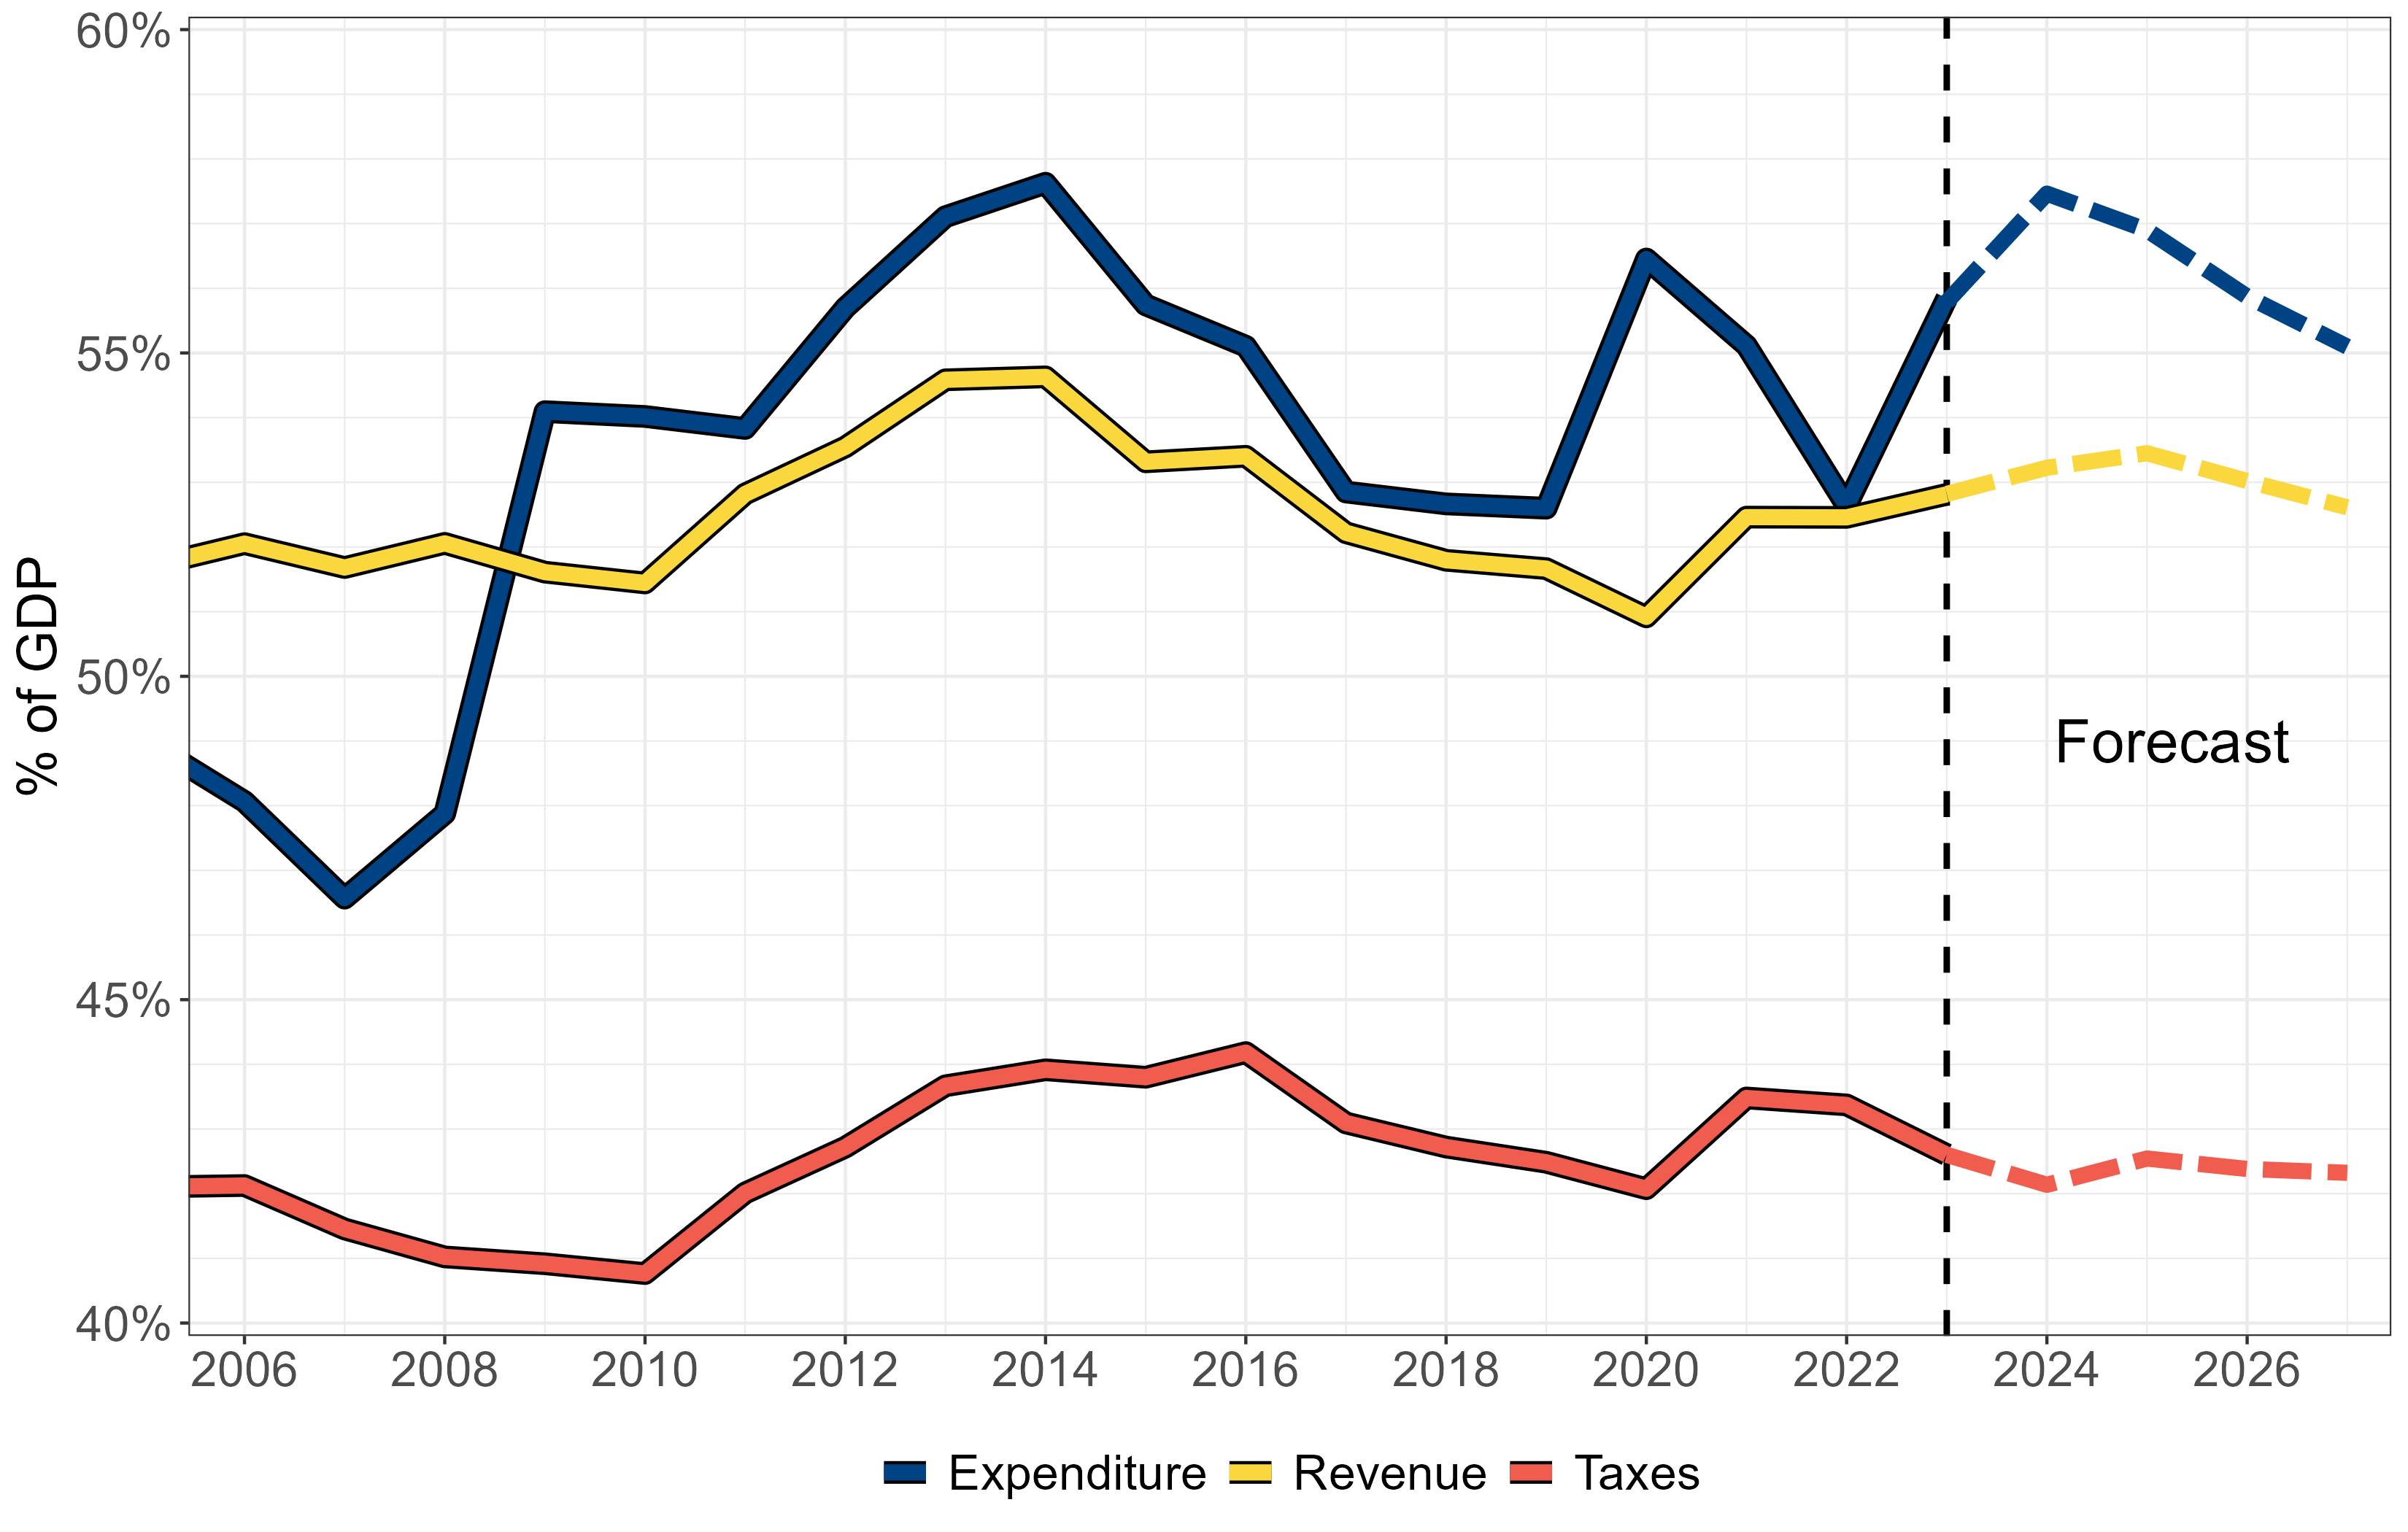
Sources: Statistics Finland and Ministry of Finance (2024b).
With sustained deficits over the last 15 years, general government debt has risen considerably from less than of GDP in 2008 to what the Ministry of Finance (2024b) forecast to be in 2024. Figure 4.3.3 plots the development of government debt-to-GDP in Finland and in selected other countries. The figure highlights that Finland’s public debt ratio is now closer to the euro area average than to its Nordic peers, which continue to maintain debt ratios similar to the levels Finland had before its debt began to rise. Both the European Commission and the Ministry of Finance forecast Finland’s debt ratio to rise further in the near term. At the same time, debt ratios are forecast to decline in Sweden, Denmark and Norway.
Sources: European Commission (AMECO database), Ministry of Finance (2024b). Notes: Blue dots represent values from the Ministry of Finance forecast.
In this forecast, the debt-to-GDP ratio will continue to rise slowly towards the end of the government’s term, without fully stabilising. The Bank of Finland (2024) forecast, also published in late December 2024, projects the debt-to-GDP ratio to increase at a somewhat faster pace compared to the Ministry of Finance (2024b) forecast. This highlights that achieving the government’s target of stabilising the debt-to-GDP ratio by the end of its term is still uncertain and would likely require either additional measures or a stronger than expected improvement in business cycle conditions. At the same time, it seems clear that without the fiscal measures introduced in spring 2024, the target would remain well beyond reach.
As shown in Figure 4.3.2, government expenditure as a share of GDP increased markedly after 2008, while the revenue share remained close to previous levels. This rise was initially driven by the decline in GDP, which caused the expenditure share to increase as public spending did not fall proportionately. During recessions, it is natural for certain government expenditure, such as unemployment benefits, to rise counter-cyclically. In contrast, government revenues often decline during downturns and increase during upturns.
Why has the expenditure share not returned to its pre-2009 levels since the initial shock? Figure 4.3.4 illustrates how nominal GDP and government revenues have followed a similar trajectory since 2008, while general government expenditure has not. Figure 4.3.5 further decomposes the changes in the expenditure-to-GDP ratio since 2008 into selected expenditure items. The expenditure share surged in 2009 due to a sharp decline in GDP without a corresponding reduction in government expenditure. The increase in the GDP share of social protection expenditure unrelated to old age (yellow bars) also reflects higher expenditure on unemployment benefits.
Source: Statistics Finland.
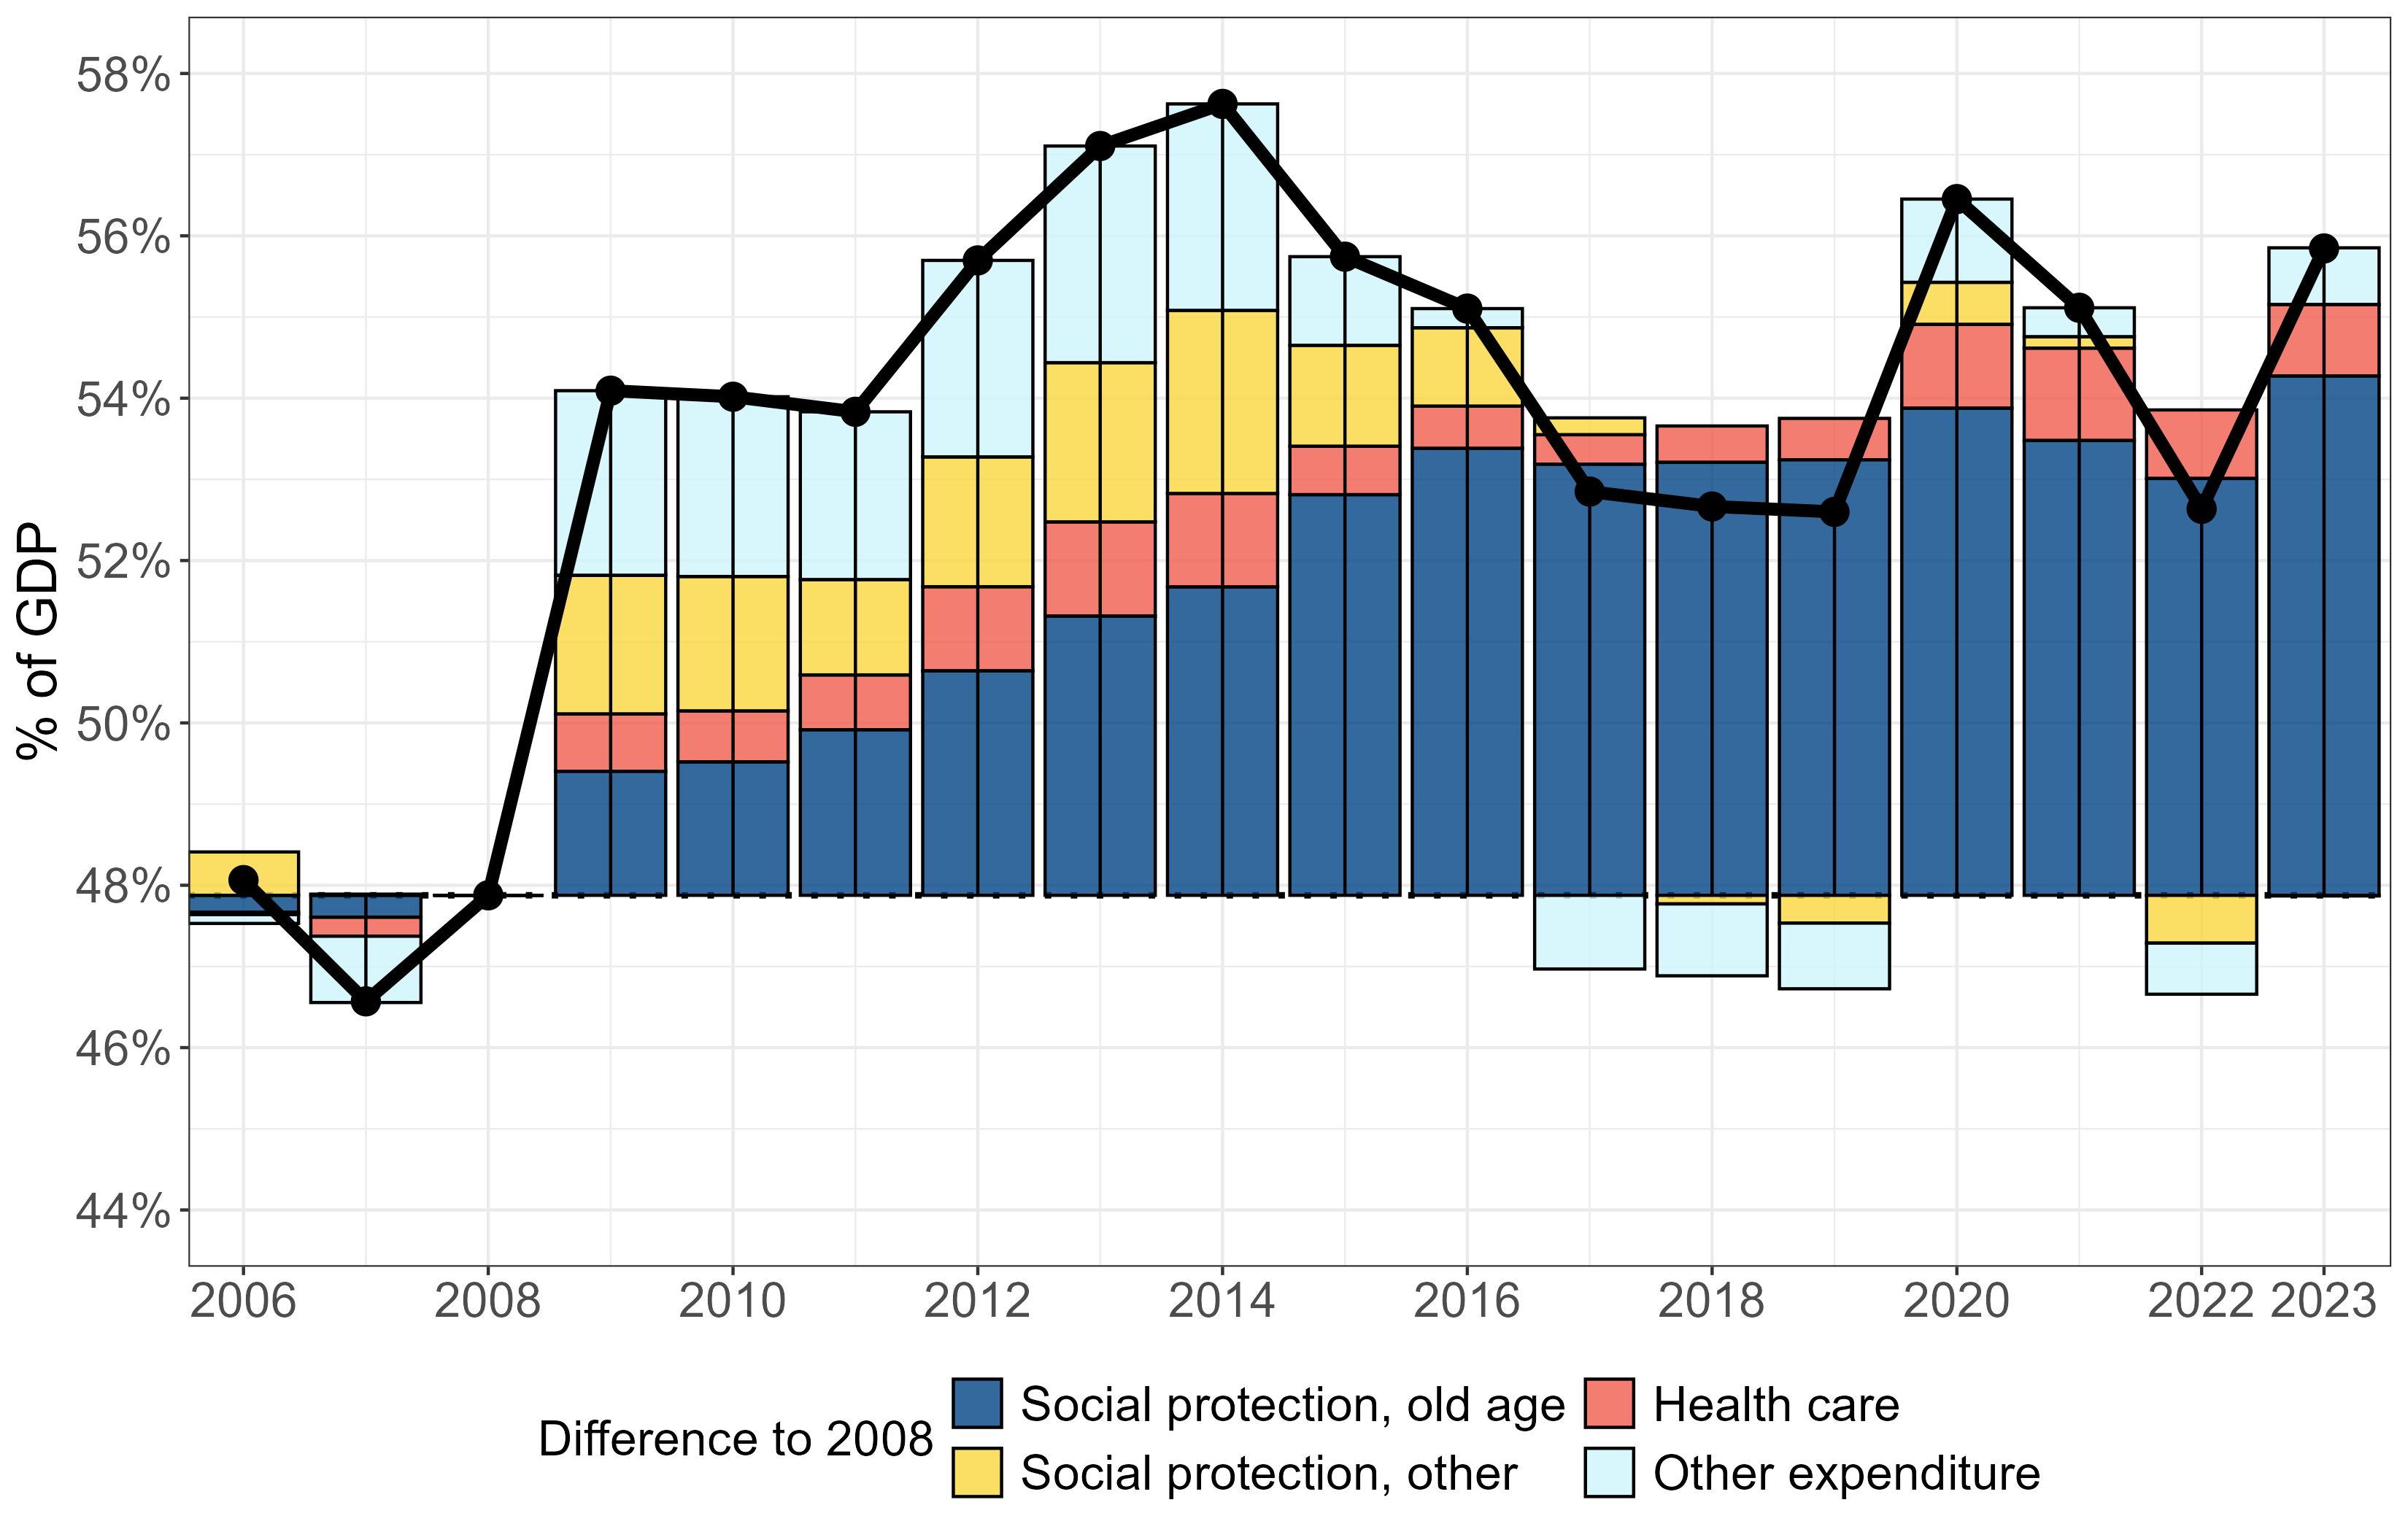
Source: Statistics Finland.
While the initial increase in the total expenditure share can be explained by the recession following the financial crisis, it would be natural to expect a reversal once the business cycle normalised. However, this has not occurred, and the expenditure share has remained consistently higher than in 2008. The decomposition in Figure 4.3.5 reveals that the increase in the expenditure share from 2008 to 2023 is largely driven by expenditure related to population ageing. The largest contributor has been the increase in social protection expenditure related to old age (blue bars), consisting mainly of pensions. This expenditure gradually increased over this period, with a total increase of more than of GDP compared to 2008. At the same time, Finland’s old-age dependency ratio (the ratio between the number of persons aged 65 and over and the number of persons aged between 20 and 64) has gradually increased from to almost .14
Conversely, the GDP share of social protection expenditure unrelated to old age (yellow bars) has declined since 2014 and was around pre-2009 levels in 2023, reflecting a substantial increase in employment compared to the early 2010s. In other words, the public deficits that were clearly linked to the financial crisis and recession in the early 2010s have since been gradually replaced by deficits driven by costs associated with population ageing.
Fiscal stance refers to the overall impact of a government’s fiscal policy on aggregate demand, indicating whether it is expansionary (stimulating aggregate demand through higher spending or lower taxes) or contractionary (reducing aggregate demand through lower spending or higher taxes) relative to some baseline, such as the previous fiscal year. There are several ways to measure it (see e.g. Ahola et al., 2017) and generally the different methods can be characterised as either ’top-down’ or ’bottom-up’ indicators.
The bottom-up approach typically aggregates the fiscal effects of the various individual policy measures that take place in a given year and compares these with a baseline of no policy change. Figure 4.4.1 shows the cumulative impact of the revenue and expenditure decisions of the current government, based on information presented in the General government fiscal plans (Ministry of Finance, 2023a, 2024d). The comparison is made against the technical fiscal plan (Ministry of Finance, 2023b), which was prepared before the current government took office and which reflects the legislation in place at that time, shaped by the policy decisions of the previous government. In the figure, positive numbers indicate an improvement in the budget balance, representing fiscal tightening.
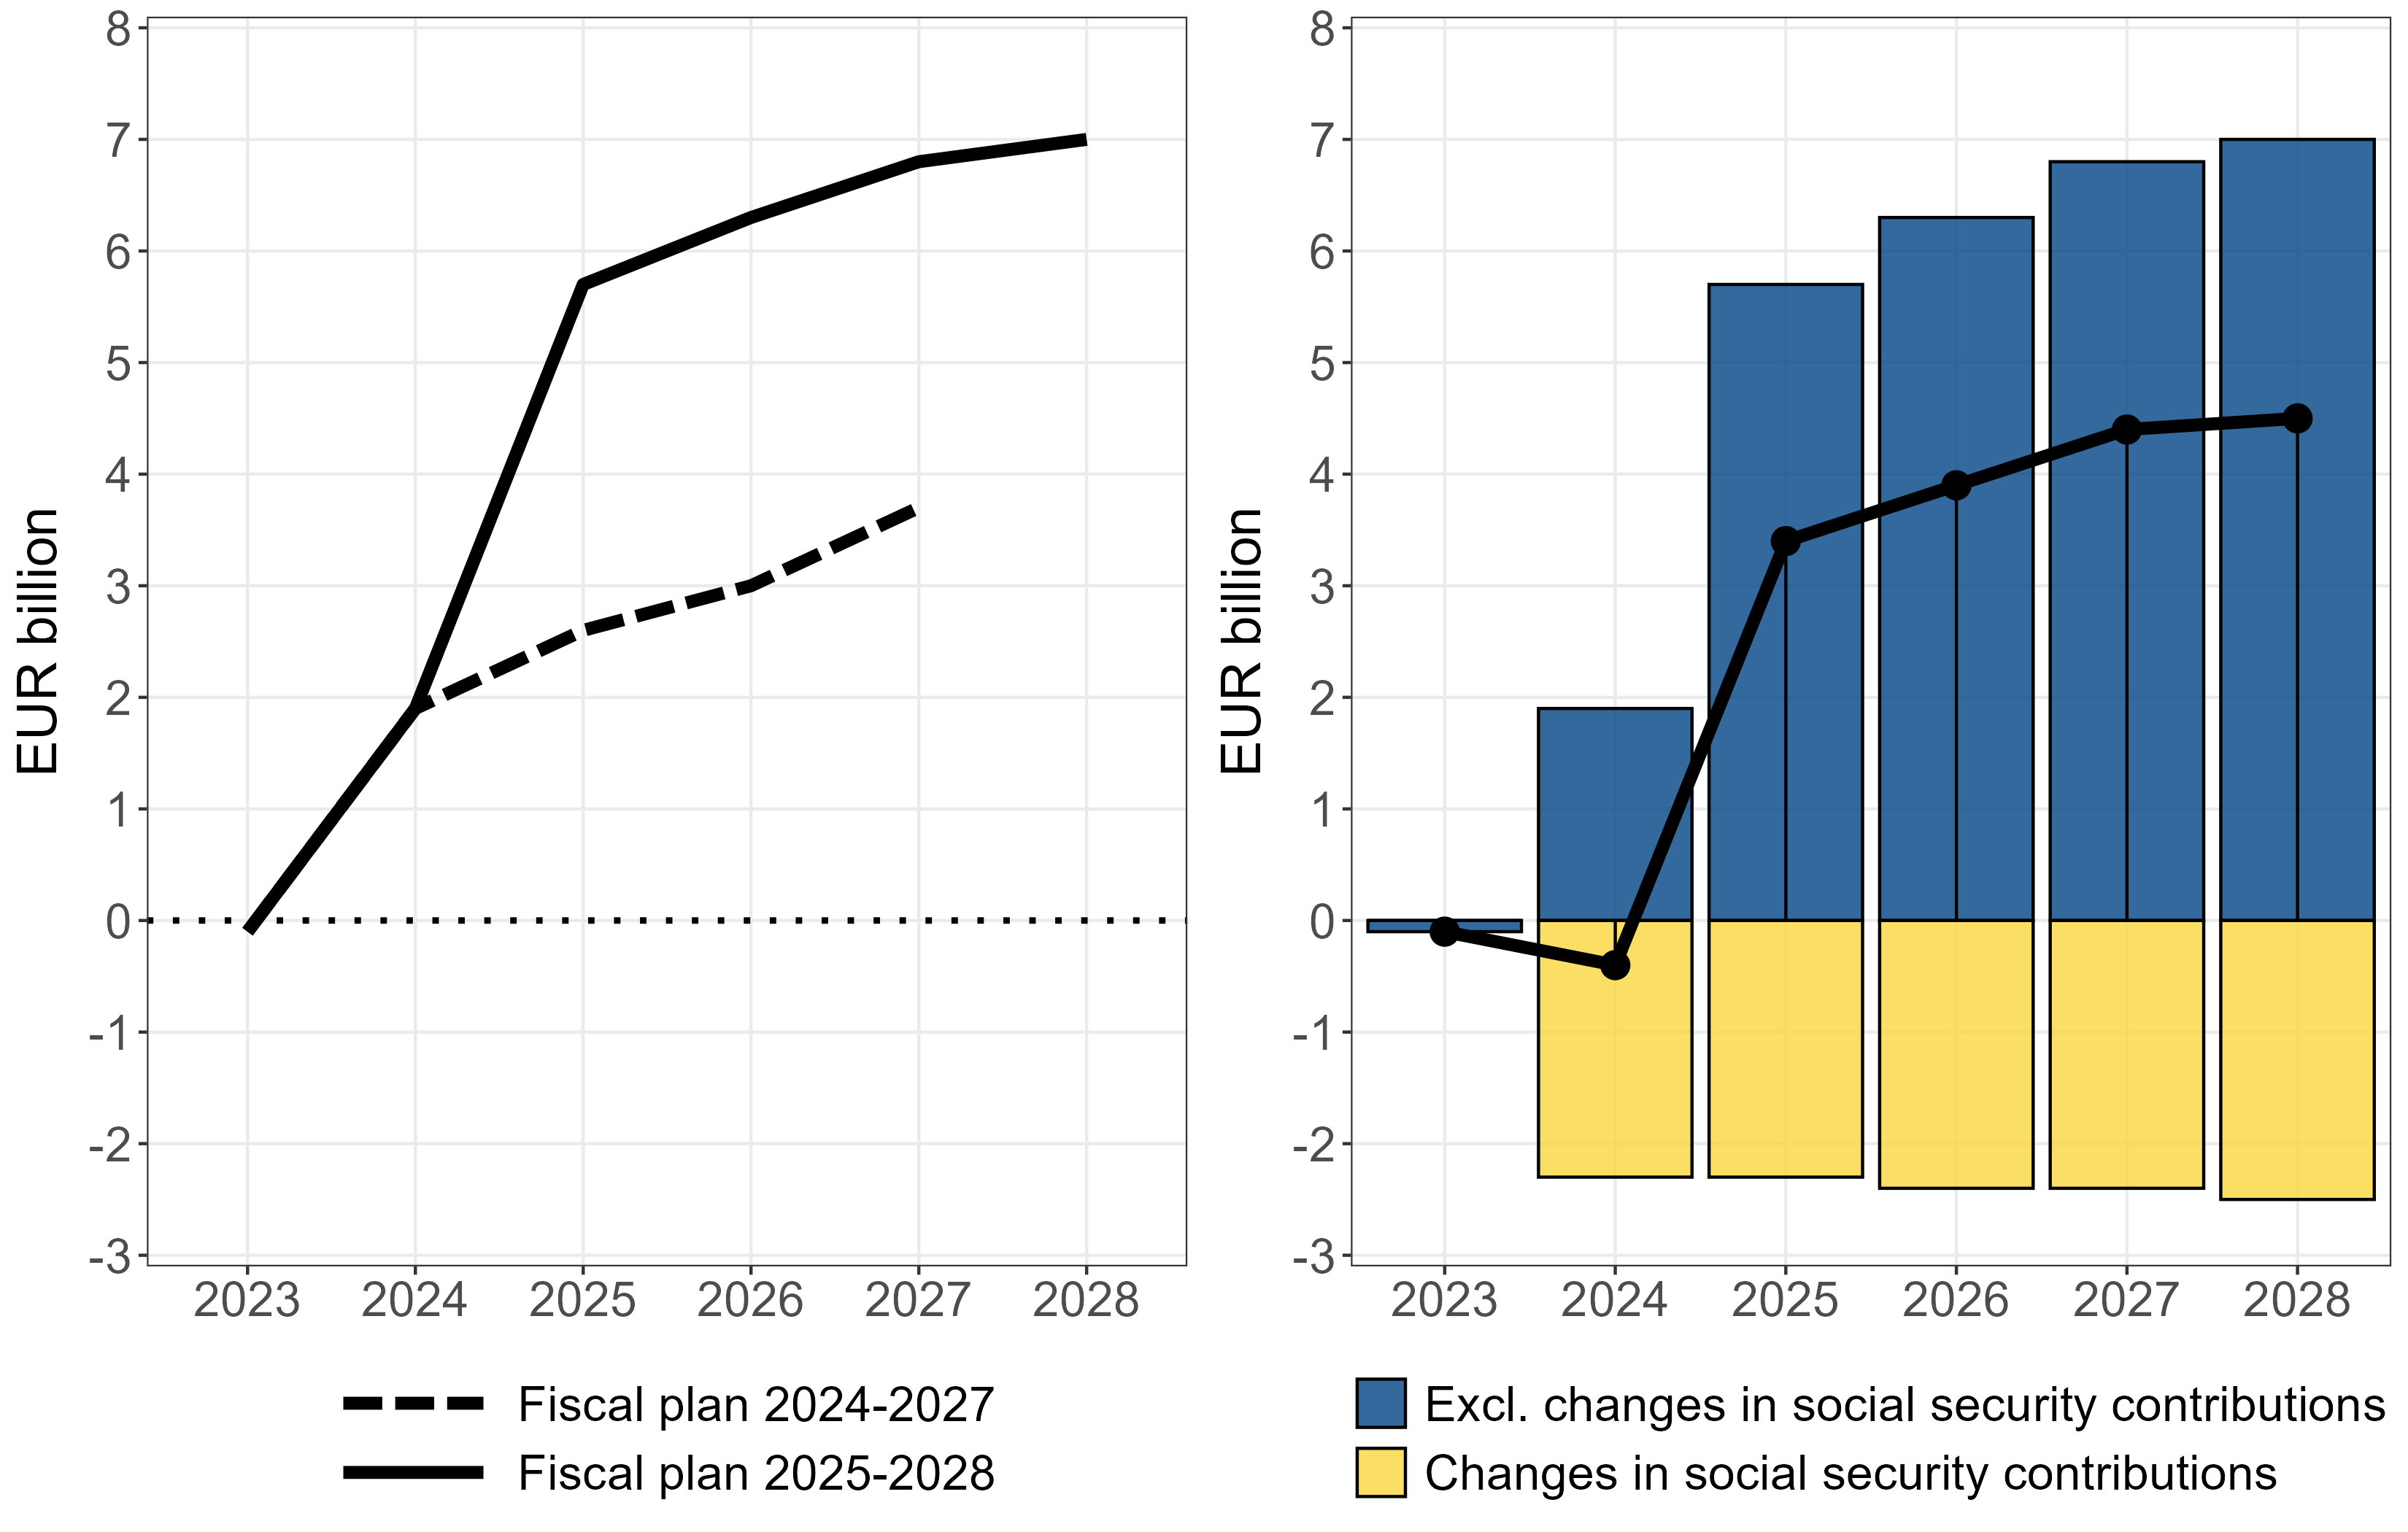
Sources: General government fiscal plans (Ministry of Finance, 2023a, 2024d) and Council’s calculations. Notes: Changes are in comparison to the technical fiscal plan published in March 2023.
The left-hand panel of Figure 4.4.1 shows the effects of policy changes on general government finances, excluding changes in social security contributions. As discussed in our previous report (EPC, 2024), a large cut in unemployment insurance contributions weakened the general government budget balance starting from 2024. This change was neither part of the government programme nor foreseen in the technical fiscal plan prior to that. Excluding changes in social security contributions from other policy measures may therefore provide a clearer representation of the fiscal impact of the government’s decisions. In contrast, the right panel of the same figure shows the total effect, including changes in social security contributions. This approach arguably provides a more comprehensive view of the actual fiscal stance.
The left-hand panel of Figure 4.4.1 illustrates how the additional fiscal consolidation measures agreed on in the spring 2024 session on spending limits tighten fiscal policy compared to the government’s initial fiscal plan. The difference between the two lines represents an additional fiscal consolidation of approximately EUR 3 billion in 2025, as the new measures are more front-loaded than those initially outlined in the government programme. When factoring in the significant cuts to social security contributions, which have an expansionary effect, the overall fiscal stance appears less tight (right-hand panel of Figure 4.4.1).15 In 2024, the net impact was close to zero, as reductions in social security contributions offset the tightening resulting from the government’s consolidation measures. However, the additional fiscal measures introduced in 2024 result in the bottom-up approach indicating a significant fiscal tightening in 2025. The right-hand panel of Figure 4.4.1 suggests that this tightening is approximately EUR 3.8 billion, equivalent to about of GDP.
Top-down measures of the fiscal stance start with the observed (or projected) headline budget balance and adjust it for factors that influence the balance independently of policy changes or shifts in the economy’s underlying structure. The most commonly used top-down indicator for assessing fiscal stance is the change in the structural primary balance. The structural primary balance is defined as the cyclically adjusted balance net of interest expenditure and one-off measures. It should represent the primary balance that would be achieved if output were at its potential level. The year-on-year change in the structural primary balance captures the variation in the government budget balance not attributable to the business cycle (through automatic stabilisers), interest expenditure, or one-off measures. It should therefore reflect structural changes in the primary balance, including changes that are due to policy.
Figure 4.4.2 shows the structural primary balance and the output gap in 2023-2027 (Ministry of Finance, 2024b). The output gap measures the difference between actual output and potential output, where a negative output gap suggests that the economy has so much unused production capacity (including unemployed workers) that it could produce more without triggering excessive inflationary pressures. If the structural primary balance weakens in response to a negative change in the output gap, fiscal policy can be considered counter-cyclical, beyond the effects of automatic stabilisers and other mechanisms captured by the cyclical component.
Source: Ministry of Finance (2024b) and Council’s calculations. Notes: Red dots are forecasts.
The change in the structural primary balance from 2023 to 2024 indicates that fiscal policy seemed to have behaved counter-cyclically (Figure 4.4.2). In 2024, the structural primary balance weakened by percentage points as the output gap widened by of potential GDP. In 2025, there is projected to be a similar tightening of fiscal policy when the business cycle improves. However, the tightening of fiscal policy measured by the change in the structural primary balance ( percentage points) is less than what the bottom-up approach would indicate for 2025 (roughly of GDP).
There are several reasons why the top-down and bottom-up approaches might indicate different fiscal stances. For example, population ageing affects the structural balance without any discretionary changes in policy. As a growing number of people transition from employment to retirement or require tax-financed old-age care, the public finances are weakened. This is reflected in the structural balance, but not in the bottom-up approach. Another relevant example in the current context is the rapid expenditure growth in the wellbeing services counties, discussed in Chapter 3.
An increasing share of individuals transitioning to retirement is likely to reduce potential output more than aggregate demand, as retirees rely on pension benefits and private savings to finance their consumption. Rising health and social expenditure, in turn, boosts aggregate demand without increasing potential output. Consequently, both trends lead to higher aggregate demand relative to potential output, similar to the effects of a discretionary fiscal policy stimulus.
The government aims to improve the public finances by boosting employment through reductions in out-of-work benefits. The total target for fiscal improvement through increased structural employment in the government programme is EUR 2 billion. As mentioned above, the Ministry of Finance (2024b) forecast assumes that the government’s reforms will increase employment gradually over time, thereby improving the structural balance in the coming years. The bottom-up approach accounts only for the direct fiscal impact of these measures (due to lower benefits) and does not include the effects of increased employment. It is worth noting that this structural employment channel works in the opposite direction to the ageing channel: higher employment reduces the structural deficit, whereas population ageing increases it.
Arguably, higher employment resulting from structural reforms does not have a straightforward or direct effect on aggregate demand relative to potential output. In other words, from the perspective of aggregate demand management, an improvement in the structural deficit driven by higher employment resulting from labour supply reforms should not be interpreted as a tightening of fiscal policy.
Another factor contributing to the differences between the top-down and bottom-up approaches in the current situation is military investments. These include the F-35 fighter jets and funding for the Squadron 2020 project, both of which will add to fiscal deficits in the coming years as the fighter jets and vessels are delivered to the military. In 2025, these investments amount to approximately of GDP and are included in the structural balance figures, as they are not treated as one-off measures. However, they are excluded from the bottom-up approach, as these investments were decided by previous governments and anticipated in advance, meaning that they do not represent new fiscal measures. Although these investments will increase deficits in the coming years, the delivery of a fighter jet from the US to Finland is unlikely to significantly boost aggregate demand for Finnish production.
In summary, it is difficult to gauge the actual fiscal stance, or its impact on aggregate demand, accurately, as the bottom-up and top-down approaches yield somewhat different results. The government’s decisions will significantly tighten fiscal policy in 2025 compared to 2024. However, the rise in public expenditure on health, social services, and pensions, coupled with reductions in certain social security contributions, offsets some of the negative impact of fiscal tightening on aggregate demand, particularly relative to the situation at the beginning of the government’s term in 2023.
New rules governing the fiscal policy of EU member states came into force in spring 2024. The reformed rules continue to rely on the reference values of and of GDP for deficits and debt, respectively, that have been enshrined in EU treaties. The reform also does not change the procedure for initiating a deficit-based excessive deficit procedure if the deficit limit is breached. The changes mainly concern the so-called preventive arm of the rules and the debt-based excessive deficit procedure. Both now build on the new national medium-term (fiscal-structural) plans (MTPs) that each member state is required to prepare.
In the medium-term plans, member states commit to a multi-year path for maximum net expenditure growth. Net expenditure is defined in the rules as government expenditure net of interest expenditure, discretionary revenue measures, expenditure on EU programmes fully matched by revenue from EU funds, national co-financing of EU programmes, the cyclical part of unemployment benefit expenditure, and one-offs and other temporary measures. Importantly, as expenditure growth is measured net of (new) discretionary revenue measures, member states can increase their expenditure more than the fiscal rules would otherwise allow if they implement corresponding tax increases or other measures to finance these increases.
The net expenditure path, which needs to be endorsed by the European Council, is meant to act as a ceiling on net expenditure growth over a period of 4 or 5 years, depending on the length of the parliamentary term. Deviations from this path will be recorded in a control account and deviations exceeding of GDP annually or of GDP cumulatively may lead to a debt-based excessive deficit procedure being started in the corrective arm. In the medium-term plan, member states may pursue an extension of the fiscal adjustment period to 7 years. Such an extension allows for a slower pace of fiscal adjustment but comes with additional requirements. Member states seeking this extension must pledge to implement a series of structural reforms and investments, with their progress monitored by the Commission.
The new rules place a greater emphasis on the so-called debt sustainability analysis (DSA) of individual member states. The medium-term plans should be consistent with a set of criteria that are designed to ensure that the debt-to-GDP ratio plausibly declines towards 60% or stays below it, and that the deficit is maintained below 3% of GDP over the medium term. (These criteria are explained in more detail in the Box below.) To meet these conditions, member states may require a certain degree of fiscal consolidation, which then acts as a limit on the growth path of net expenditure that the country can commit to in its MTP. The required fiscal adjustment is determined using the DSA framework of the European Commission, taking into account country-specific assumptions (European Commission, 2024).
Net expenditure paths presented in the national medium-term plans should
comply with the following conditions in the EU fiscal rules.
DSA-based criteria:
Debt decreasing under deterministic scenarios
Debt is put on or remains on a plausibly downward path (or stays below of GDP) over the 10 years following the adjustment period both under the adjustment scenario and under 3 adverse stress tests:
Debt declining with sufficient probability
Deficit below of GDP
Deficit benchmark and safeguards:
Deficit benchmark
Debt sustainability safeguard
Deficit resilience safeguard
The government approved Finland’s first medium-term plan (Ministry of Finance, 2024c) in October 2024. As part of the fiscal rules, the debt sustainability safeguard requires Finland to reduce its debt ratio on average by at least of GDP per year over the adjustment period. Given current debt projections, it is this safeguard that puts the most stringent restriction on the net expenditure path for Finland.16
In the plan, Finland is applying for an extension to the adjustment period from 4 years to 7 years. This extension appears crucial, as even with the quite sizable and front-loaded consolidation that the current plan includes the required decline in the debt ratio would not be achieved within 4 years. Even under the 7-year adjustment plan, the requirement is only barely met: debt ratio declines from in 2024 by percentage points to in 2031 (on average per year), as can be seen in Figure 4.5.1. As discussed below, the projections for the debt ratio in the medium-term plan differ from the the Ministry of Finance’s forecast because of differences in the underlying assumptions.
Source: Ministry of Finance (2024c).
In the new framework, the required fiscal adjustment is first calculated in terms of an adjustment in the structural primary balance, which governs the development of the debt ratio. Based on this, a corresponding path for net expenditure growth that achieves the targeted adjustment is determined. In the absence of any fiscal adjustment, expenditure growth equal to nominal GDP growth (in the fiscal rule framework: GDP deflator plus potential GDP growth) would keep expenditure as a share of GDP constant over time. When fiscal consolidation is required, the path for net expenditure growth should be lower than this. This is illustrated in Figure 4.5.2 using actual values from Finland’s medium-term plan.
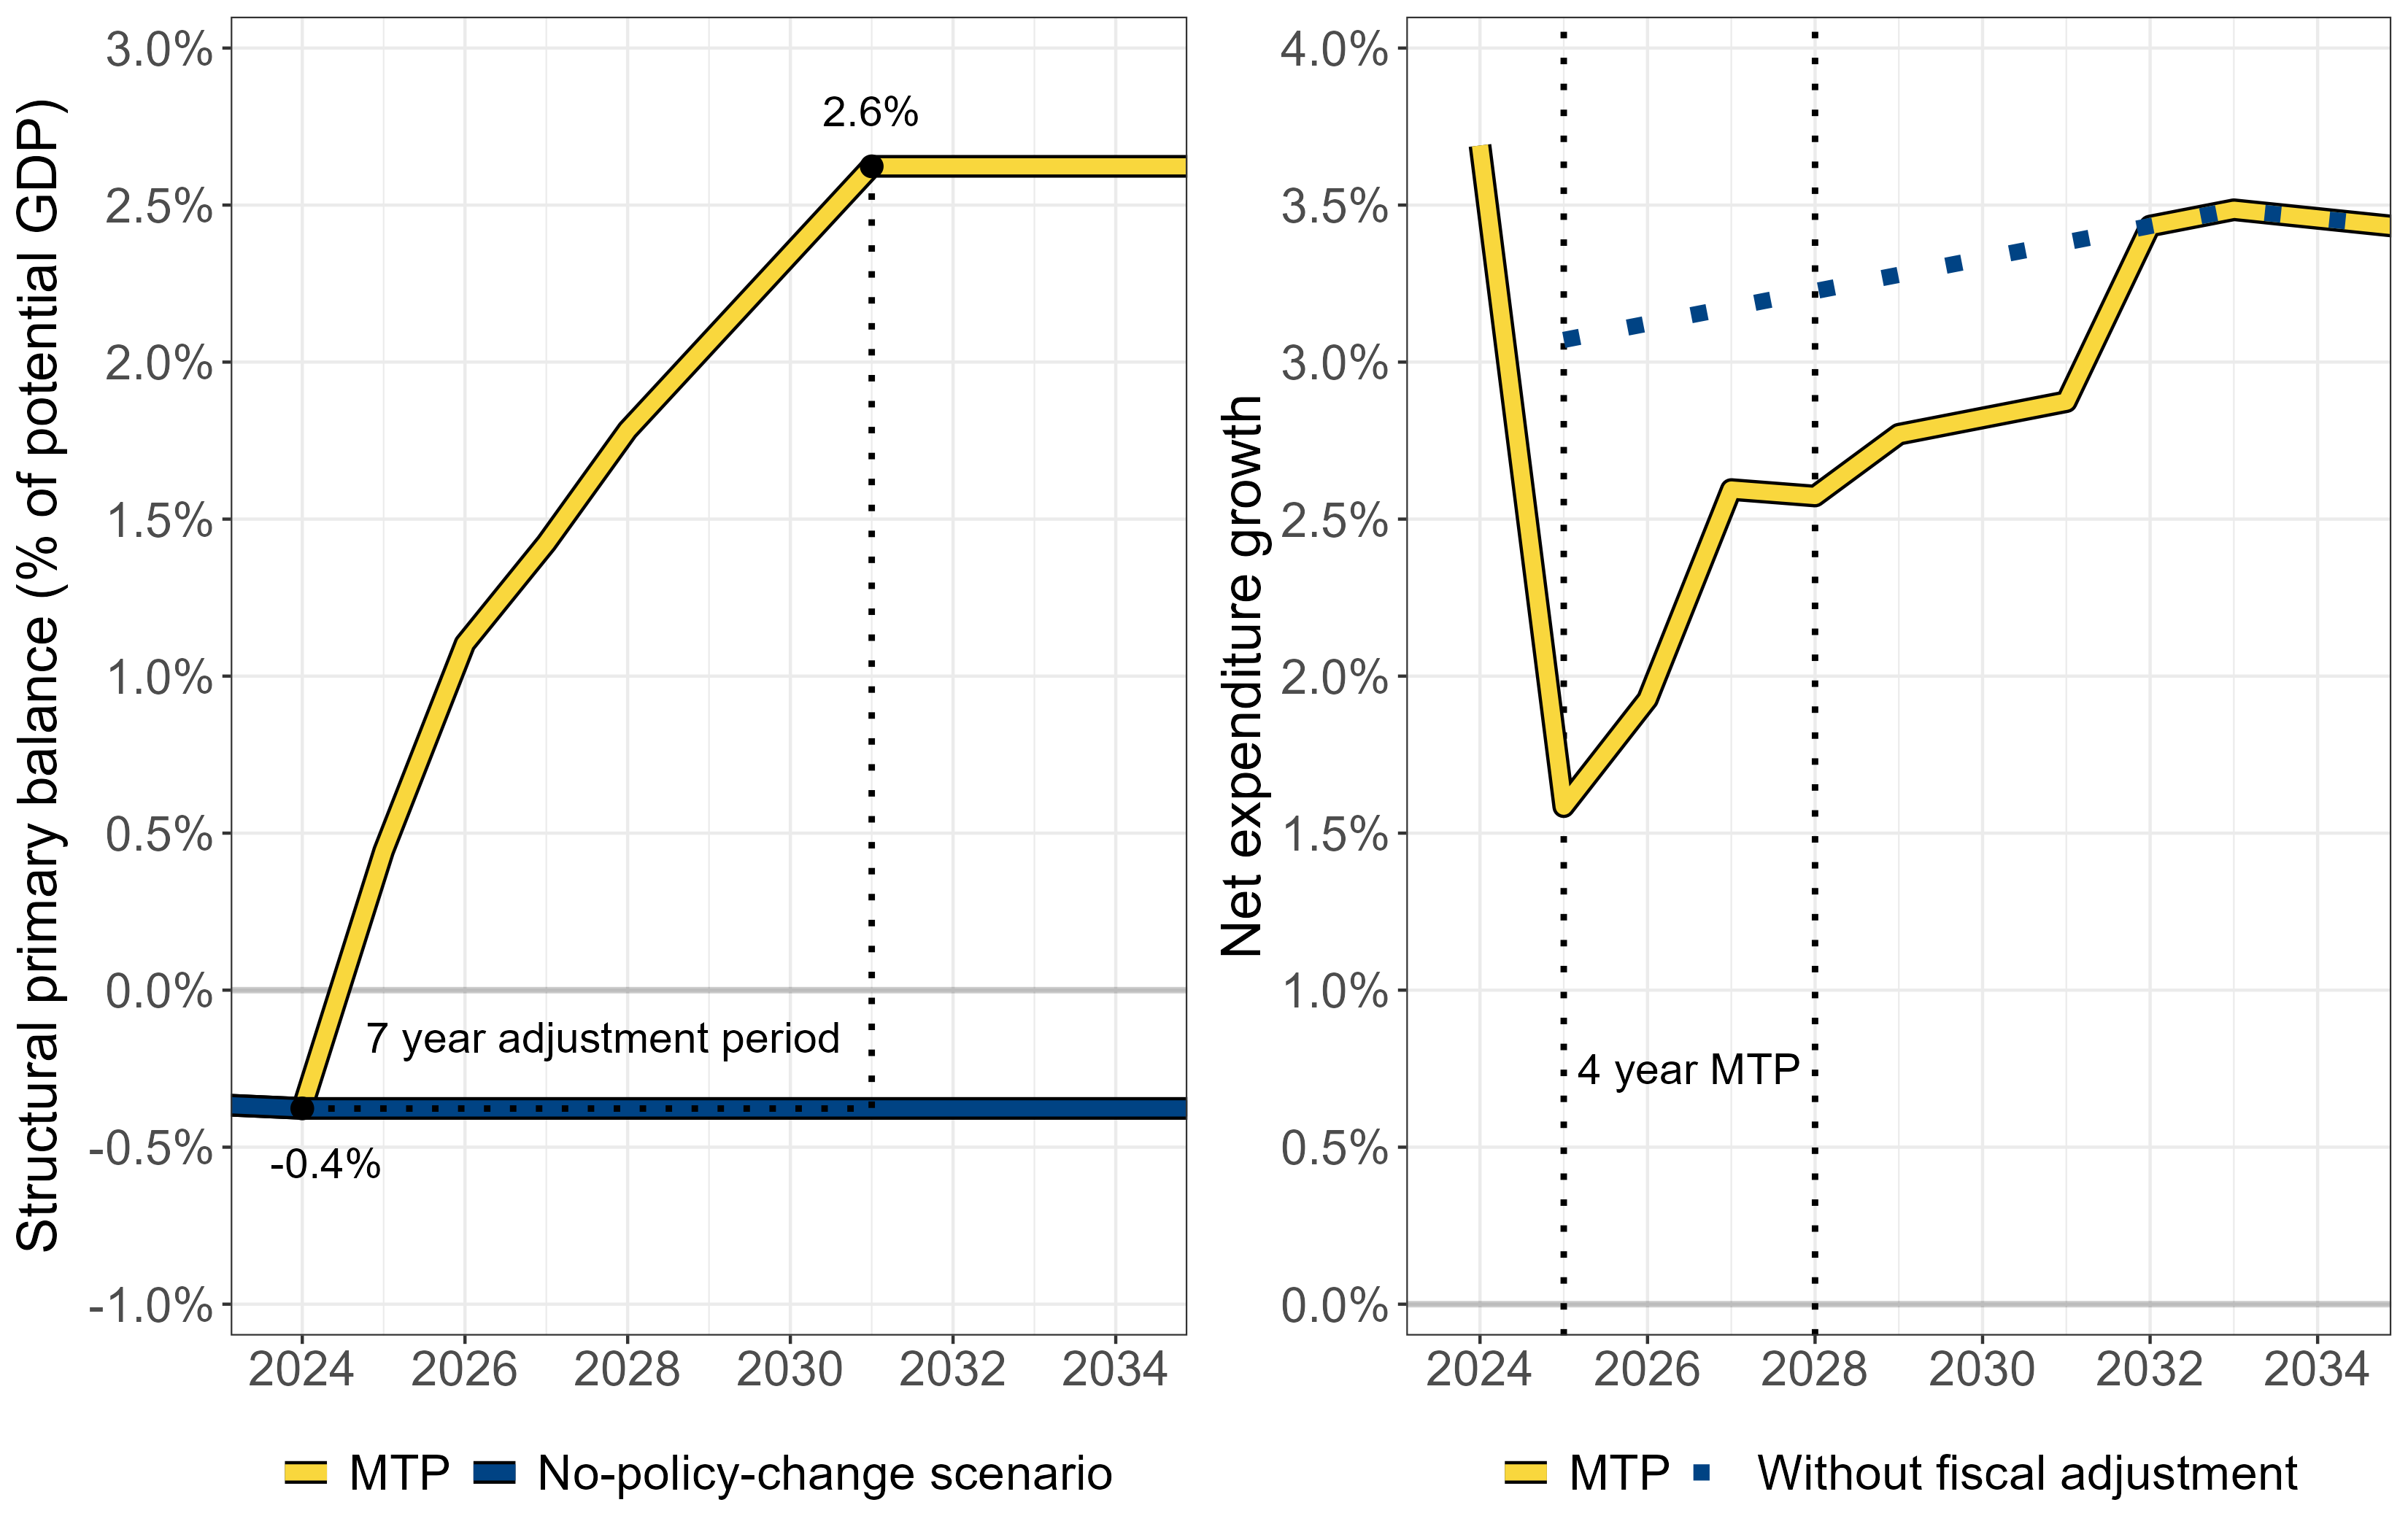
Source: Ministry of Finance (2024c) and Council’s calculations. Notes: On the right panel, the dotted blue line is equal to nominal potential GDP growth in the MTP projection.
The left panel of Figure 4.5.2 shows the adjustment in the structural primary balance over the 7-year adjustment period. The total adjustment amounts to of potential GDP. This fiscal adjustment in the left panel of Figure 4.5.2 limits the growth of net expenditure in the right-hand panel of the same graph. The yellow line in that figure is consistent with the required fiscal consolidation (in the left-hand panel), while the dotted blue line gives the ceiling on the growth of net expenditure that would apply to Finland if there was no need for fiscal adjustment. The yellow line also outlines the path of net expenditure growth that Finland is expected to adhere to in 2025-2028 if the plan is approved by the European Council—a likely outcome given the positive statement recently issued by the Commission.
The government argues in Finland’s medium-term plan that the consolidation measures already outlined by the government will suffice to achieve compliance with the net expenditure path it commits to (Ministry of Finance, 2024c). If this is the case, the new EU fiscal rules do not appear to require additional fiscal consolidation. However, the need for fiscal adjustment in the current plan extends beyond this government’s term (beyond 2027).17 Also, Finland’s deficit is exceeding the limit in 2024 and the risk of a deficit-based excessive deficit procedure arguably prompted additional fiscal tightening already in spring 2024, irrespective of the reform to the EU fiscal rules.
As mentioned above, some of the assumptions used in the MTP deviate from what the independent forecast by the Ministry of Finance (2024b) projects. For instance, Finland is using the option permitted by the rules to replace the path of potential GDP growth given by the Commission’s commonly agreed methodology with a more stable one. In the current MTP, potential GDP growth is assumed to be constant at over the period 2024-2041. This contrasts with the lower potential growth rates projected for the next few years in the economic forecasts of both the Ministry of Finance and the European Commission. Assuming higher potential GDP growth in the early years of the MTP reduces the need for fiscal adjustment and raises the ceiling on net expenditure growth in the current plan. If these assumptions turn out to be overly optimistic, the actual fiscal outcomes, such as the development in the debt ratio, are most likely to fall short of the projections in the plan.18
The European Green Deal has an overall goal of reaching net-zero greenhouse gas (GHG) emissions by 2050. The ‘Fit for 55’ package sets an intermediate target of at least a 55% net GHG emissions reduction by 2030 compared to 1990. The green transition will have economic effects across the EU even before 2030. Finland has its national targets in line with the EU targets and the government is committed to the objectives of the Climate Act.
While there has been clear progress in reducing GHG emissions in industrial processes and energy production, there are considerable challenges in other sectors.
One problem is that Finland’s forest carbon sink has declined significantly in recent years, making it almost impossible for Finland to meet its net emissions target for the land-use sector in 2021–2025 and posing challenges for the 2026–2030 target as well. As we emphasised in our previous report (EPC 2024), this creates a fiscal risk, as Finland may need to purchase carbon sink units from other member states. The fall in the forest carbon sink is partly due to increased felling, which also accelerates biodiversity loss in forests, contrary to the EU’s goal of halting biodiversity loss by 2030. Furthermore, emissions from agriculture have seen little to no decrease, and emissions in the transport sector are declining only slowly. The government’s recent decision to lower the distribution obligation for renewable fuels between 2024 and 2027, along with cuts in fuel and car taxes, is likely to further impede emission reductions in the transport sector.
The government’s main strategy to respond to these challenges appears to be to promote the green transition with various subsidies and grants. The government has decided to invest in the advancement of so-called technological carbon sinks, which refer to technological solutions for permanently removing carbon from the atmosphere. The government has earmarked EUR 140 million of its investment programme for grants to support the development and use of carbon capture, utilisation and removal solutions.19
The government has also introduced a temporary tax credit for large industrial investments that should support the transition to a net-zero economy, such as battery and hydrogen projects and fossil-free steel. In line with the current EU regulations, the credit may amount to 20% of the total investment, up to a maximum of EUR 150 million per project. The tax credit is granted until the end of 2025 for new investment projects. Once the project is completed, the credit can be deducted from the corporation tax payable from 2028 at the earliest.
Following the previous government’s budgets, the budgets for 2024 and 2025 also classify certain government expenditure as promoting carbon neutrality. This expenditure spans various sectors and totals approximately EUR 2.2 billion in 2025, as shown in Table 4.6.1.
|
| 2024* | 2025* | 2026 | 2027 | 2028 |
| Biodiversity, water protection and environmental protection | 127.6 | 134.4 | 130.5 | 130.3 | 130.3 |
| Renewable energy and energy efficiency | 507.2 | 601.6 | 492.2 | 230.3 | 172.3 |
| The global dimension | 224.8 | 199.0 | 197.3 | 204.5 | 204.5 |
| Research and development | 321.5 | 304.8 | 289.4 | 323.1 | 363.7 |
| Transport | 294.2 | 303.1 | 264.6 | 252.8 | 206.4 |
| Agriculture, forestry, and the land-use sector | 600.4 | 680.2 | 659.9 | 563.3 | 577.8 |
| TOTAL | 2076 | 2223 | 2034 | 1704 | 1655 |
Sources: Proposal for 2025 Budget (*) and Ministry of Finance (2024d).
It is difficult to evaluate these policies, but there are reasons to be sceptical about their cost-effectiveness in addressing the key challenges outlined above. Technological sinks may eventually become an important tool for achieving net-zero GHG emissions and encouraging firms to begin considering adoption of them could be beneficial. However, while these technologies are expected to be first applied to CO2 emissions from biomass combustion, they are unlikely to contribute significantly to Finland’s climate targets in the land-use sector before the 2030s due to various technical challenges.20
The investment credit has the advantage of applying only to new investments, rather than rewarding past ones. However, as Einiö et al. (2024) point out, it has several unappealing features that limit its cost efficiency. The criteria for receiving the credit are relatively broad, apart from the requirement that it must be granted by the end of 2025, making it likely that the credit will also support investments that would take place regardless. For these investments, tax revenues are lost without a corresponding increase in investments. Additionally, the high minimum investment threshold of EUR 50 million favours large firms over smaller ones. Furthermore, the credit is expected to primarily benefit firms within the EU Emissions Trading System (ETS), where emission reductions may not directly result in a decrease at the EU level, as they may free up emission permits for use elsewhere. Moreover, our main challenges are related to the slow reduction in emissions from the effort-sharing sector and the land-use sector.
Finally, the appropriations in Table 4.6.1 are used to finance a large set of different projects and subsidies, and their impact on carbon emissions or other environmental externalities is unclear.
Subsidies that partially overlap with the emissions trading system and have uncertain impacts are unlikely to be the most cost-effective way to support the green transition, particularly from a taxpayer perspective. Finland’s new climate policy actions should focus more clearly on reducing emissions in the effort-sharing sector and strengthening carbon sinks in the land-use sector. This could be achieved through instruments that generate public revenue during the green transition, rather than subsidies or grants that add to public expenditure. One concrete step in this direction would be to remove tax concessions for the use of wood for energy production.
The government has implemented most of the direct savings measures outlined in the government programme either in 2024 or from the beginning of 2025. These measures mainly consist of cuts in social benefits and reductions in certain social and health services.
The government has also taken new steps to strengthen public finances. These include a 1.5 percentage point increase in the standard VAT rate, a slight tightening of the taxation of pension income, and additional savings measures targeting social and health services as well as public administration. The VAT increase took effect in September 2024, while most of the other measures will be implemented in 2025.
Broadly speaking, these new measures are well in line with the government’s main fiscal policy objectives. The decision to include tax increases (without offsetting cuts elsewhere) represents a change in strategy, as they were not part of the consolidation package outlined in the government programme. This move strengthens the government’s credibility in pursuing its fiscal targets, especially as tax revenues might otherwise decline in relation to GDP. It also provides greater flexibility to protect the most vulnerable groups, in line with the government’s stated objective in its programme. The VAT increase is distributed relatively evenly across a broad group of people; however, it is worth noting that pensioners are largely shielded from the increase, as pensions already in payment are almost fully adjusted in line with the VAT increase.
A potential concern related to the new measures is whether the planned savings in public administration can be achieved without significantly reducing its quality. Improving the efficiency of public administration should arguably be seen as an ongoing process within the different administrative units, rather than being driven by top-down decisions requiring sudden staff cuts.
Despite the implementation of the government programme and new consolidation measures, the public debt-to-GDP ratio is projected to grow relatively quickly in 2025. Moreover, it remains uncertain whether the measures taken so far will be sufficient to achieve the government’s main fiscal objective of stabilising the debt ratio by the end of its term.
One reason for this is the weakening of the business cycle since the beginning of the government’s term. Another factor is that some consolidation measures were uncertain from the outset. For example, the government programme assumed that measures to increase labour supply would strengthen public finances by approximately EUR 2 billion annually through higher employment. These measures focus on improving labour supply incentives by reducing transfers for those not working. Their impact is difficult to estimate and will in any case take time to be fully realised, as higher employment requires that current unemployed find jobs. The weakened economic situation is likely to have further delayed their impact.
A third factor is the rapid growth in spending by the wellbeing services counties, which has led to significant deficits for the counties in 2023 and 2024 and is set to weaken central government finances in 2025 and 2026 due to retroactive adjustments to central government funding.
The financial challenges faced by the wellbeing services counties can also jeopardize the quality and availability of public health and social services, which are crucial for the most vulnerable groups. The government’s decision to lower minimum staffing requirements does little to alleviate the situation, as it is accompanied by a corresponding reduction in central government funding to the counties.
The new EU fiscal rules came into effect at an inconvenient time from the government’s perspective, midway through its term. On the other hand, the government’s programme aligns well with the spirit of these rules in terms of its objectives. Thanks to the flexibility built into the rules, it appears that the government will not have to make significant changes to its fiscal policy as a result of the new elements in the framework, at least for the time being. However, Finland’s entry into the EU’s excessive deficit procedure cannot be ruled out.
The government’s consolidation measures imply a tightening of fiscal policy in the coming years and especially in 2025. The rise in unemployment over the past year and a half, combined with Finland’s lower inflation compared with the rest of the euro area, suggests that the timing of these measures is not ideal from the perspective of stabilising aggregate demand.
On the other hand, employment remains relatively high compared to pre-COVID-19 levels and the output gap can is expected to improve in 2025. In addition, public spending, especially on health care, is increasing even in the absence of new government decisions. At least part of this increase is likely to boost aggregate demand, partly offsetting the impact of consolidation measures. The recent easing of monetary policy in the euro area should also begin to strengthen aggregate demand in 2025. Against this background, and given the risks associated with a rapid increase in the public debt ratio, we do not consider the government’s fiscal stance in 2025 to be too restrictive. However, barring an unexpectedly rapid improvement in the business cycle, it would be prudent to avoid measures that further reduce aggregate demand in the short term.
Regardless of the economic cycle, the government should consider reforms that will strengthen public finances in the long run without decreasing aggregate demand in the short-run. The pension reform mentioned in the government programme is an important opportunity in this regard. For example, eliminating the accrual of certain benefits in the earnings-related pension system that are not linked to wage earnings could reduce future pension expenditure without weakening the connection between individual pension contributions and benefits or undermining labour supply incentives. The resulting savings could strengthen central government finances without increasing the overall tax burden, for instance, by increasing income taxes to offset reduced social insurance contributions.
In climate policy, stronger measures are needed to reduce emissions in the effort-sharing sector and to strengthen carbon sinks in the land-use sector. Missing these targets undermines the credibility of Finland’s climate policy and increases the fiscal risks. From a public finance perspective, it would also make sense to place more emphasis on taxes and fees related to emissions or the reduction of carbon sinks, rather than relying as heavily as current policy does on subsidies and grants for activities related to reducing emissions.
The Finnish labour market is characterised by persistent regional disparities. Additionally, demographic shifts are likely to exacerbate challenges in both local and nationwide labour market matching. Obstacles to internal migration and skills mismatches, in turn, may hinder ongoing efforts to increase employment rates.
This chapter analyses regional labour markets, wages and productivity, and employment. We begin by presenting empirical evidence on regional differences in wages and worker productivity in Finland, based on the background report by Bratu and Lyytikäinen (2024). We then examine regional and occupational mismatches in the labour market. This analysis is based on the background report by Uusitalo et al. (2024). Finally, we assess the very recent reform of public employment services (TE24 reform), which transferred employment services to the municipalities.
Workers in larger cities earn more than workers in smaller cities and rural areas. This phenomenon is referred to as the urban wage premium (UWP) and has been documented in many countries (e.g. Germany (Dauth et al., 2022), Spain (De la Roca and Puga, 2017), Sweden (Eliasson and Westerlund, 2023) and the US (Glaeser and Maré, 2001)). Bratu and Lyytikäinen (2024) report similar findings using Finnish data.
Figure 5.1.1 is taken from Bratu and Lyytikäinen (2024) and it illustrates the differences in mean annual earnings across travel-to-work areas (TWA) and how these differences are related to the size of the area, measured in terms of the number of jobs. The numbers in Figure 5.1.1 do not take into account any regional differences between the characteristics of the workers and firms, such as the level of education or industry. The earnings differences between regions are large and there is a clear positive connection between mean earnings and the size of the city. Helsinki is by far the largest TWA and workers in the Helsinki TWA earn, on average, 15% more than workers in the second-largest TWA, Tampere (EUR 46,000 vs. EUR 40,000).
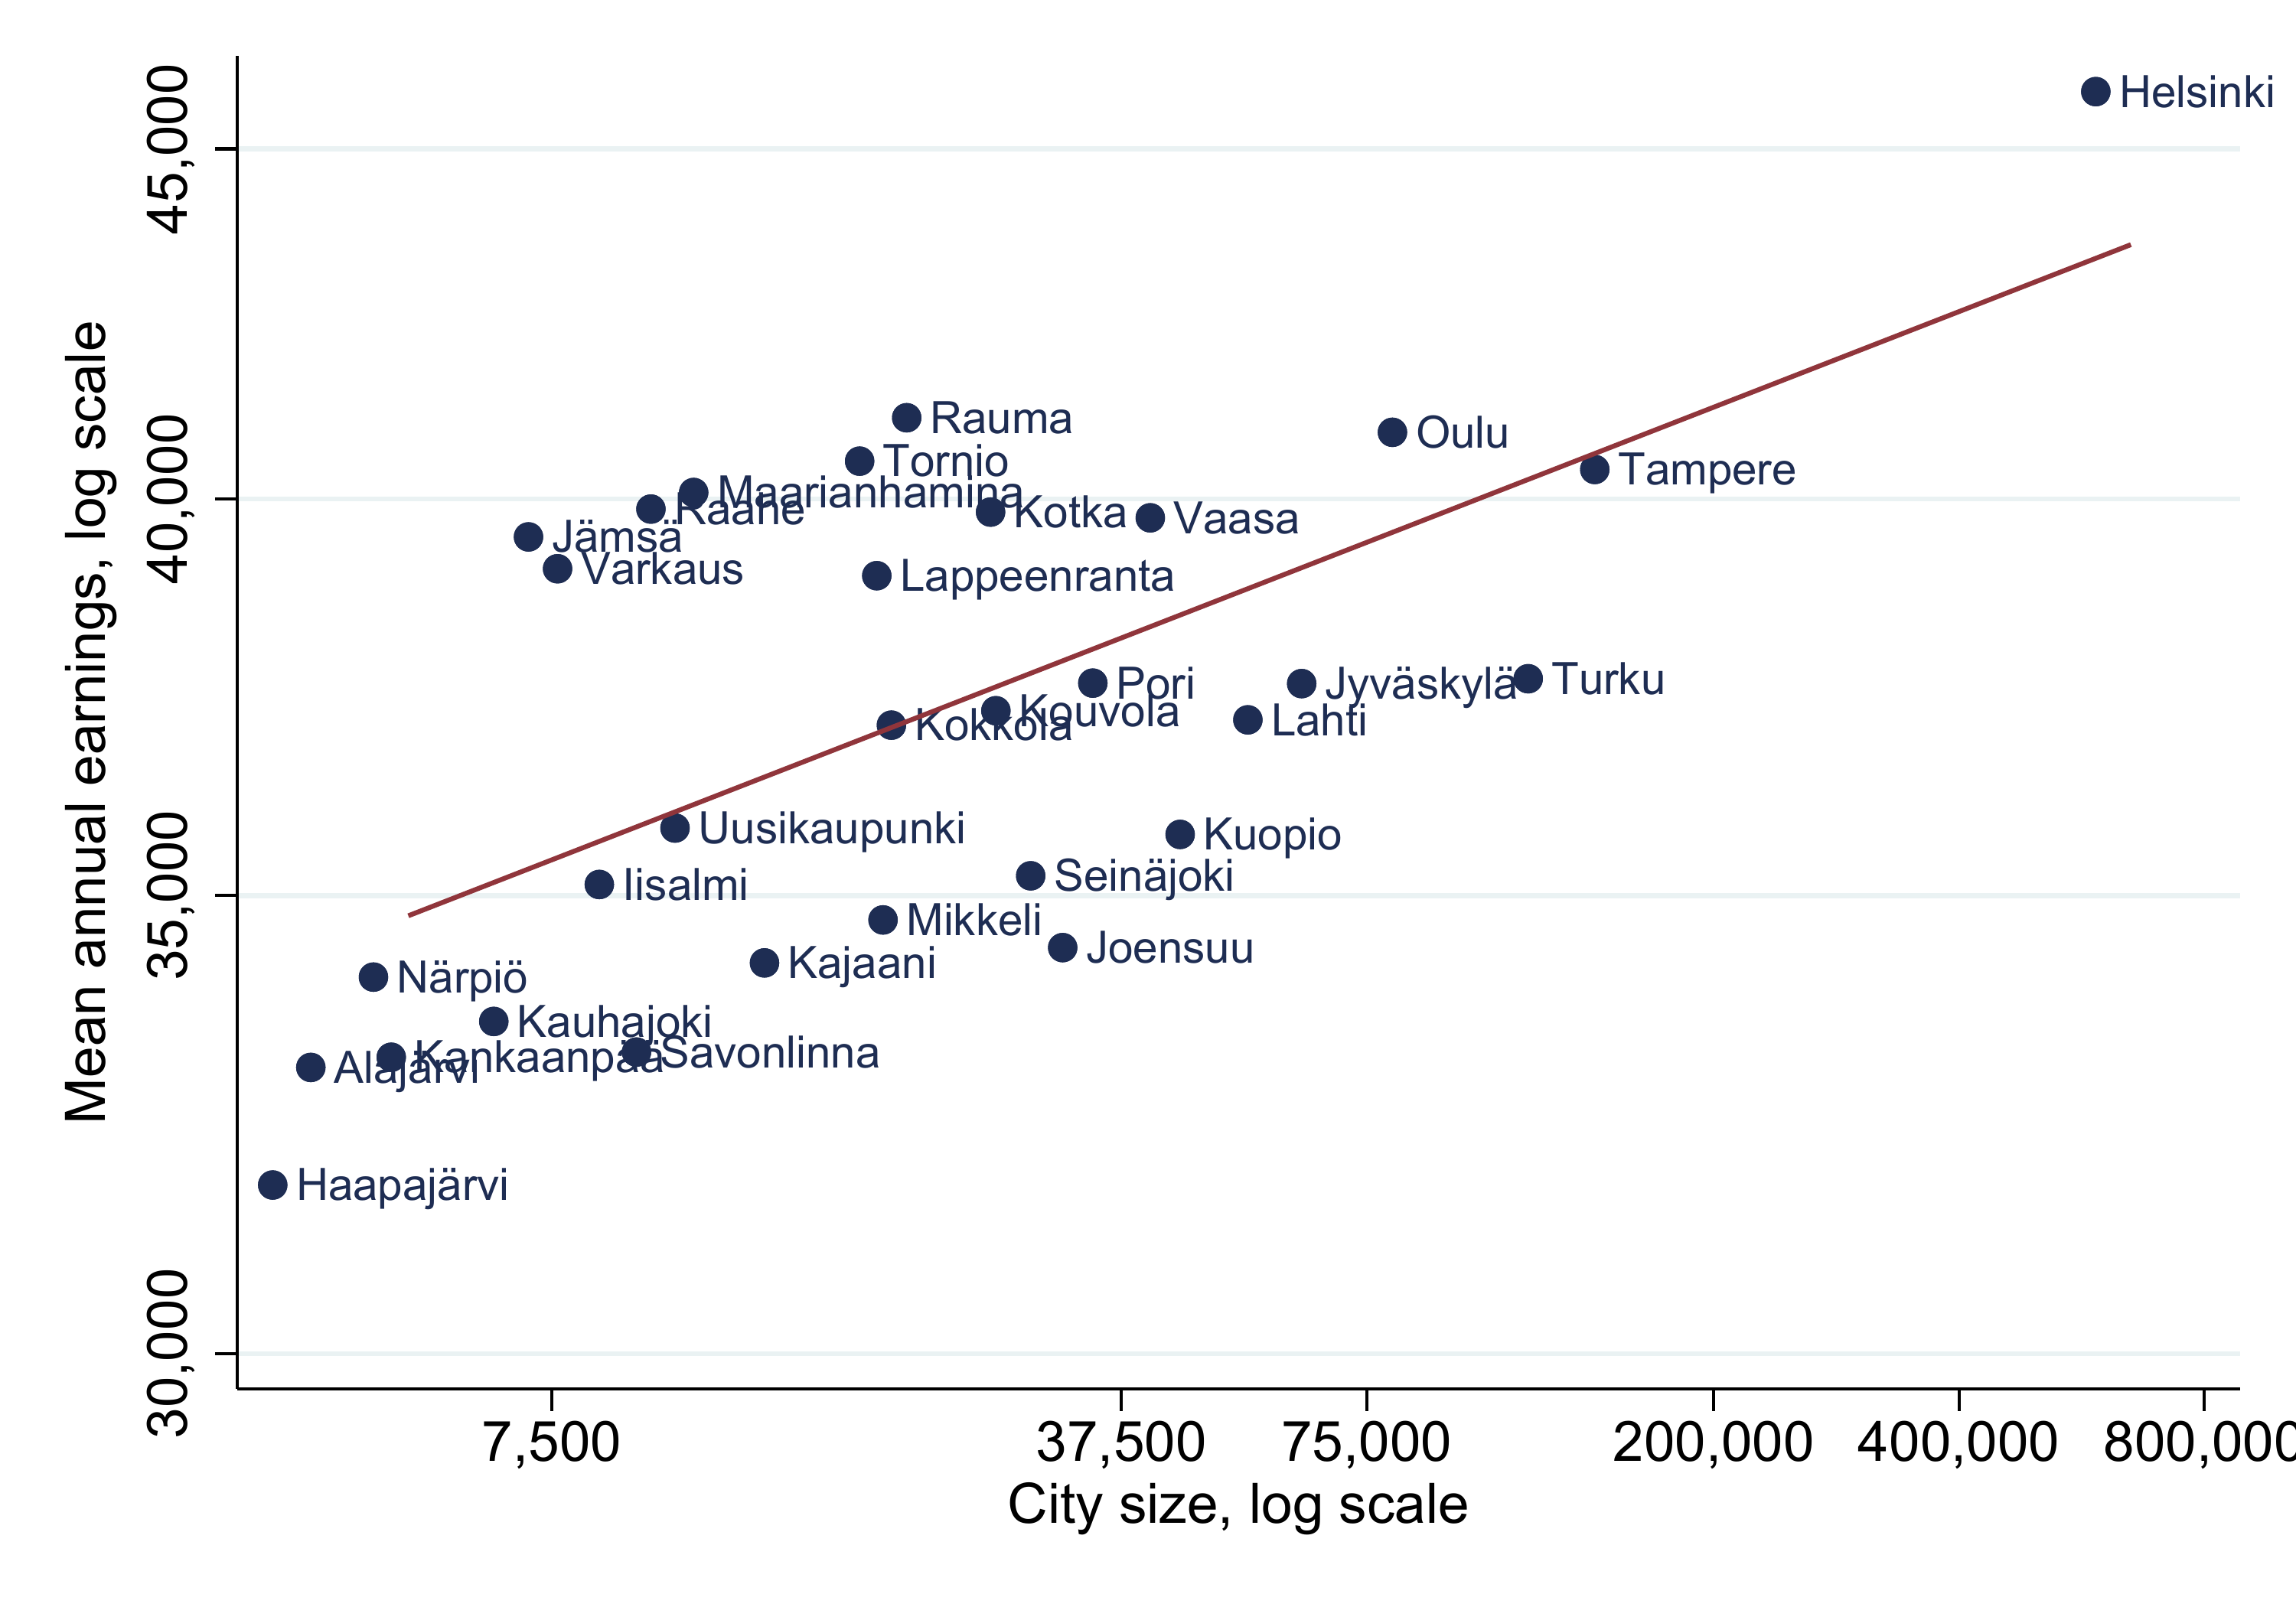
Source: Bratu and Lyytikäinen (2024).
The important question for the labour market and regional policy is whether these earnings differences are causal. That is, does increasing the size of the city make workers in that city more productive, resulting in higher wages due to various agglomeration economies, or are workers in larger cities different from their counterparts in smaller cities in terms of their human capital and skills? As Hsieh and Moretti (2019) point out, if labour productivity is higher in larger cities, aggregate productivity can, in principle, be increased by increasing the size of large cities at the expense of smaller lower-productivity cities and regions.
Bratu and Lyytikäinen (2024) study the urban wage premium in Finland in more detail using individual-level matched employer-employee data that allows them to follow workers over time and across space. Their key finding is that even after controlling for a rich set of job and worker characteristics and worker fixed effects there is a substantial UWP in Finland. The elasticity of earnings with respect to city size is roughly 2.4%, which implies that doubling the size of the city increases earnings by 2.4% on average. They also find that workers in the Helsinki TWA earn some 8% more than similar workers in the Tampere and Turku TWAs and that workers in Tampere and Turku earn 1.4% more than workers in smaller regional centres.
Bratu and Lyytikäinen (2024) also analyse dynamic effects to see how work experience is reflected in wages and whether the effect of work experience depends on the size of the city where that work experience was gained. They find that a year of experience in the Helsinki TWA increases earnings by 1.9% compared to working in other TWAs during that year. Furthermore, experience accumulated in Helsinki is portable, so when workers relocate from Helsinki to another TWA they continue earning more than similar workers in the destination TWA. One interpretation of this finding is that by working in a large city workers accumulate skills and human capital that do not depreciate when they relocate to a smaller city.
More generally, however, the mechanisms behind the UWP in Finland remain unclear. In addition to the natural advantages of larger cities, such as advantageous geographical location, one potential mechanism is more efficient matching in larger labour markets. For example, Dauth et al. (2022) find evidence of assortative matching in the German labour market so that high-productivity workers work in high-productivity firms. This assortative matching is tighter in larger cities than in smaller cities. Another possibility is that firms have less labour market power in large cities and have to pay higher wages. However, the finding by Bratu and Lyytikäinen (2024) about the portability of the benefits of work experience in Helsinki contradicts this mechanism.
As Bratu and Lyytikäinen (2024) note, if agglomeration economies significantly influence productivity differences, policies that encourage workers to relocate from smaller to larger cities would have both direct and indirect impacts. Relocation of workers to larger cities and the Helsinki area in particular directly increases their productivity, as described above. Indirectly, an increase in the size of destination cities enhances the productivity of other workers in those cities, whereas worker productivity may decline in the shrinking origin cities and regions. The overall effect on national productivity and output depends on the magnitudes of these indirect effects. If the agglomeration benefits are equal in size at the margin between regions, the indirect effects cancel out, and the positive effects on the productivity of relocating workers dominate the effect on overall productivity (Bratu and Lyytikäinen, 2024). In this case, increasing the size of the largest cities would increase overall productivity.
Cities also grow through immigration. When moving into cities, immigrants bring about agglomeration economies by increasing city size without countervailing productivity decreases in other parts of the country.
If workers can earn higher wages in larger cities, why do more workers not flock to larger cities and to the Helsinki area in particular? One reason is that housing costs consume a large fraction of the nominal wage increase from moving to a larger city. The Helsinki TWA offers higher wages, but it also has the highest housing costs in Finland. This is due to inelasticity of the housing supply. Of course, workers value other regional aspects of quality of life besides wages, which also affect their location decisions.
Given the results of Bratu and Lyytikäinen (2024) regarding Finland and the wider literature on agglomeration economies, is there something the government can or should do to increase the size of the largest local labour markets in Finland? Bratu and Lyytikäinen (2024) highlight three ways that the government can affect the spatial distribution of the workforce and the set of local labour markets to which workers have access.
First, cities can grow in population only if they increase the supply of housing and commercial real estate. As we argued in our previous report (EPC, 2024), in Finland, municipalities oversee land use and zoning policies related to housing supply, and central government has only limited policy options through which it can affect municipal decision-making. As mentioned in Chapter 2, the construction sector experienced a severe contraction in 2023 and 2024. Notably, this contraction also occurred in larger cities with relatively high housing prices. There are good reasons to believe that this is a temporary downturn and housing supply continues to be an important impediment to city growth. Thus it is important to look for policy options that make the supply of housing and commercial real estate more responsive in areas of high housing costs.
Second, improvements in transportation infrastructure can connect firms with a new pool of workers and other firms, thereby increasing the effective size or density of the local labour market without directly affecting the location of firms and workers. However, recent Finnish evidence suggests that the benefits of agglomeration are mainly intraregional rather than interregional (Haapamäki et al., 2024). Importantly, any individual infrastructure project should go through a rigorous cost-benefit analysis.
Finally, various place-based policies, such as grants from central government to municipalities or counties that provide welfare services, can, in principle, influence the location of workers and firms (Lyytikäinen et al., 2024). However, these types of subsidies have historically been directed towards low-productivity regions (Saarimaa et al., 2015). When reforming these grant systems, more attention should be paid to the locational incentives that the grants create for workers and firms and how they are related to productivity.
After the COVID-19 pandemic, working from home has increased in some occupations and sectors. Working from home has the potential to increase the effective size of the local labour market areas because workers can work for a firm located in a particular labour market area without having to live in that same area. The interesting question here is whether workers working from home and living away from urban areas receive the same urban wage premium as workers who work and live in urban areas. However, it is still unclear how working from home with fewer face-to-face contacts with co-workers affects productivity.
Unemployed people often have different skills and employers have different needs, so it takes time for well-matched jobseekers and employers to get together. It is therefore not surprising that the labour market typically has many vacancies alongside unemployed jobseekers.
However, the Beveridge curves at the end of Chapter 2 (Figure 2.3.2), fitted for different periods, reveal that from 2013 to 2024, Finland generally had more unemployed individuals and job vacancies (relative to the labour force) than in the period 1994–2012. Similarly, any given unemployment rate now seems to be associated with a higher number of job vacancies than in the past. This suggests that the labour market has become slower or less efficient in matching jobseekers with employers. Over a longer period—comparing 2013–2024 with 1978–1990—the trend looks even worse.
Understanding this trend could help design better employment policies. One explanation is that jobseekers tend to look for jobs within their region or occupation, while vacancies are increasingly concentrated in different regions or sectors. An increase in such regional (geographical) or occupational mismatches could lead to a simultaneous increase in unemployment and vacancies relative to the labour force. This may reflect structural changes in the economy. In Finland, as in many high-income countries, manufacturing jobs have declined in recent decades, while service sector jobs have increased. New service sector jobs are often not located in the same areas as former manufacturing jobs.
Uusitalo et al. (2024) examine the evolution of regional and occupational mismatch in Finland from 2006 to 2021 using registry data on jobseekers and vacancies. Their data includes information on the location and occupation of jobseekers and the location and occupation of vacancies. Building on previous studies, the authors estimate how the geographical distance between jobseekers and vacancies affects the probability of employment and also examine the role of occupational distance, measured in different ways.
The results show that both geographical and occupational distance have a clear impact on employment. For example, jobseekers rarely accept a job that is far from their current place of residence. However, the findings indicate that the number of hires lost due to regional and occupational mismatches is so small that it can explain only a minor share—likely less than 10 per cent in recent years—of unemployment. This is because most jobseekers can find many vacancies close to where they live, with requirements that broadly match their educational background and work experience. Similar results have been found in studies from other countries (e.g. Marinescu and Rathelot (2018)) and in an earlier study focusing on Finland using similar methodologies (Alasalmi (2022)).
Interestingly, the study also finds that the importance of regional and occupational mismatches has not increased over the period considered; if anything, it seems to have decreased. Uusitalo et al. (2024) provide evidence that this decline is due to an increasing concentration of jobseekers and vacancies in the same regions and occupations, possibly reflecting the ongoing urbanisation in Finland.
These findings have at least one clear policy implication: Devoting substantial public resources to promoting regional or occupational mobility is unlikely to be an efficient way of reducing unemployment.
On the other hand, the results do not explain the shift in the Beveridge curves shown in Chapter 2 or why the labour market appears to have become less efficient in matching jobseekers with vacancies—they merely rule out one potential explanation.
In the absence of increasing regional or occupational mismatches, one possible explanation for the shift in the Beveridge curve is that available jobs have become less attractive to workers. The government’s decision to increase the financial incentives to accept lower-paid jobs by cutting various benefits can be seen as consistent with this interpretation.
Another possibility is that even if the unemployed are trained in in-demand fields, their skills may not match the needs of employers. This interpretation would underline the importance of updating skills and possibly adopting more flexible wage-setting practices. The observed increase in mismatch problems may also be related to immigration, as some immigrants are slow to integrate into the labour market.
Finally, the shift of the Beveridge curve may reflect changes in the composition of the pool of jobseekers (Eeckhout and Lindenlaub, 2019). While the Beveridge curve relates the ratio of vacancies to unemployment, vacancies are also open to employed individuals searching for new opportunities. Increased job search activity among the employed can potentially crowd out unemployed jobseekers, reducing their likelihood of finding a job. This would manifest as an outward shift in the Beveridge curve.
In spring 2021, the government of Prime Minister Sanna Marin decided to transfer employment and economic development services (commonly known as TE services) to the municipalities. This decision was an important part of the previous government’s employment policies, with an estimated employment effect of persons. The new legislation came into force from the beginning of 2025. The new system was piloted in an experiment with voluntary municipalities.
The reform has changed the body responsible for public employment services (PES). Interestingly, PES have been transferred from central government to the municipalities, while responsibility for social and health services has recently been transferred from the municipalities to the wellbeing services counties, with strong central government guidance. At the same time, the changes to the rules for financing unemployment benefits also increase the role of the municipalities in the labour market. In the following the main elements of the reform are reviewed and discussed.
Public employment services transferred to employment areas
Firstly, the reform has transferred the provision of PES to the municipalities or to employment areas consisting of several municipalities with a labour force of at least .21 Prior to the reform PES were carried out in TE Offices, which were state authorities.22
Negotiations between the municipalities resulted in the establishment of 45 employment areas effective from the beginning of 2025. Four cities provide the services themselves (Helsinki, Vantaa, Lahti, Kouvola). Other municipalities cooperate with their neighbouring municipalities in providing these services. There are 39 employment areas where the services are organised under a so-called host municipality model and two employment areas use a so-called joint municipal authority model. Municipalities forming an employment area need to border each other and they should form a functional labour market area with respect to commuting, for instance. The number of new employment areas (45) exceeds the number of TE Offices (15), which were the responsible public authority prior to the reform.
The main aim of the reform is to improve the matching of jobseekers and employers at the local level. The decentralised services are manifold. They include job intermediation services, plans (for employment, activation and integration), various expert assessments (competence and vocational skills, work ability), tasks related to job search (coaching, monitoring, sanctions), experiments (training, work try-out), labour market training, right to self-motivated studies while receiving unemployment benefit, pay subsidies and start-up grants. Key digital services (like Tyomarkkinatori.fi website) will continue to be organised at the national level even after the reform.
Not all the services provided by the TE Offices have been transferred to the municipalities. For instance, immigrant work permit services have now been fully transferred to the Finnish Immigration Service (Migri) even though the reform of the integration act (KOTO24) transferred the overall responsibility of integration services to municipalities. Furthermore, while the new employment areas are responsible for various services for employer clients (like recruitment and guidance), business development tasks (like delivering some business subsidies) are left to 15 ELY centres. The division of tasks is not totally clear since municipalities have increasingly created their own programmes to draw in new businesses to the area. Broadly speaking, municipalities have welcomed the reform, which seems to offer them opportunities to meet local needs better than the earlier model for providing the services in question. Enhancing regional vitality was one of the key motivations cited when the reform was originally decided upon. The interest of municipalities in the transfer of PES has also strengthened their role as the main providers of vocational education.
Employment services are now a statutory duty of the municipalities, and they are granted full state funding to finance this obligation (i.e. the same amount of funding that the TE Offices in total would have received in the old system).23 At the mature phase, the general-purpose state grant is based on a capitation model that builds on the number of working-age (18-64) inhabitants (weight ) and on the number of unemployed persons (including those in active labour market programmes) (weight ). The grants are updated yearly according to the most recent population and labour market data.
The municipalities get a strong role in unemployment compensation
In the second phase of the reform the municipalities will be given a larger role in the financing of unemployment benefits and their share of the costs is dependent on the duration of unemployment spells. In terms of the estimated employment effects this part of the reform package is even more important than the transfer of PES.
Even prior to the TE24 reform (since 2006), the municipalities have been partly responsible for the costs of labour market support24 in cases of unemployment lasting over 300 days (so-called penalty payments). Under the old rule, the municipality’s cost share was and the municipalities paid the corresponding amounts to Kela ( if the days exceeded 1000 days). Under the new legislation, the cost burden begins earlier with a lower cost share, but the share increases up to depending on the duration of the unemployment (see Table 5.3.1).
| Unemployment duration (days) | Cost share () |
Even more importantly, the municipalities will also participate in the financing of earnings-related and basic unemployment allowances. Here the cost-sharing rule is applied to the basic component of these schemes (corresponding to the level of labour market support) and the scale is the same as that shown in Table 5.3.1. The idea is that if an unemployed person finds a new job quickly, it is beneficial not only to the individual but also to the municipality. This is likely to motivate municipalities, as providers of employment services, to apply the best possible policies to achieve this positive outcome. This includes, for instance, choosing the most effective active labour market measures if mere job intermediation services are not enough.
Furthermore, now the municipalities are also partially responsible for the unemployment benefits paid while the person participates in active labour market measures. In other words, the municipalities cannot practice cost-shifting by using these measures mainly as a tool to reduce their own commitments. The popularity of the pay subsidy scheme is further reduced by a more recent reform, with the result that the pay subsidy scheme no longer contributes to entitlement to earnings-related unemployment insurance (work requirement) (HE 13/2024).
The municipalities are compensated for their increasing share in financing unemployment benefits through a supplement to their state grants. The compensation they receive is based on the cross-sectional situation prior to the reform, i.e. the information on actual payments of unemployment benefits in 2023 at the municipal level. Under the new rules, the compensation is indexed to price changes (National Pension Index), but it is not adjusted in other ways for future years. The motivation is to reward those municipalities where unemployment is maintained on a decreasing trajectory and punish those municipalities that are going in the wrong direction. The current government’s decision to freeze benefits indexed to the National Pension Index applies to this compensation too.
The estimated employment effects of the two reforms presented above were given in the government proposal for the new legislation in 2022 (HE 207/2022). The total estimate is persons, but it is difficult to discern the relative roles of the two parts of the proposal. Furthermore, according to the proposal these two reforms overlap with the 2022 reform that increased job search obligations (the so-called Nordic labour market service model) and it is difficult to disentangle the contributions of each individual reform.
The reforms take place in a situation with rising unemployment, which is likely to increase the workload of caseworkers providing services for the unemployed. This, together with a relatively weak outlook for municipal finances, may increase the challenges in the implementation phase.
The medium- and long-term effects are uncertain even though the transfer of public employment services to the municipalities was preceded by three pilot projects in which voluntary municipalities were given the opportunity to organise employment services for specific target groups. The pilots were arranged in 2012-2015, 2017-2018 and 2021-2024 and their employment effects have been analysed ex post (Arnkil et al. (2015), Nieminen et al. (2023) and Aho et al. (2024)).25 These evaluations do not support the view that the decentralisation of employment services as such leads to employment improvements. On the other hand, the current reform includes additional elements that were not part of the pilots. These new elements are the abolition of the cost-shifting possibility described above and the increasing role of the municipalities in financing unemployment benefits. These elements are likely to increase the employment effects of the reform.
One possible unintended consequence of the reform is that it increases the incentives to exclude unemployed individuals from the municipality through housing and zoning policies. For instance, a strategy to exclude low-income or unemployed individuals is to predominantly zone for single-family homes and minimize the provision of social housing. It is also easier to attract high-income taxpayers when municipal unemployment rate is low, because then statutory municipal services can be financed with a lower tax rate. This is one reason why the literature on fiscal federalism often advocates for redistributional policies to be administered by central rather than local governments.
Barriers to employment are multifaceted and tackling them often requires cooperation between employment services and rehabilitation and healthcare providers. Cooperation between employment and healthcare services would be easier if the providers were the same authorities. Now that the municipalities are responsible for employment services and the wellbeing counties are responsible for health and social care, there is a risk of service shortfalls and harmful attempts at task- and cost-shifting. The weak economic situation of both authorities at the beginning of the new system increases the risks.
The increasing cost share of the municipalities in financing unemployment benefits influences the targeting of active labour market instruments. Municipalities are likely to start to make more justified choices and use more information concerning the effectiveness of various policies among different subgroups of jobseekers. On the other hand, there might be also a side effect in that currently inactive but potentially employable persons may not receive the services that they need. It is important to monitor the choices the municipalities make when they become the key actors in providing employment policies.
The number of jobseekers is clearly dependent on economic fluctuations and unemployment benefit expenditure is more cyclical than for instance healthcare expenditure. Municipalities have to cover their deficits within a four-year timeframe. Therefore it is preferable for them to have relatively predictable and stable expenditure and revenue. In the new system, revenue related to financing unemployment benefits at the municipal level is predictable, but the expenditure fluctuates. This can pose problems in keeping the books in balance and may also affect the financing of other municipal services, such as education. Furthermore, the level of funding is based on the labour market situation in a single year (2023), which may not represent a typical year in terms of unemployment for some municipalities. A better approach would have been to base funding on a longer reference period. Additionally, maintaining the same level of revenue poses problems in the case of sudden large-scale dismissals in a municipality.
Labour productivity can likely be enhanced by increasing the size of the largest cities. Cities can grow in population only if they increase the supply of housing and commercial real estate. This is one reason to pursue policies that make the supply of housing and commercial real estate more responsive to demand. Continuing the government’s cooperation with municipalities through land use, housing and transport (MAL) agreements is likely to be essential in this regard.
Population concentration in cities may, on the other hand, have negative impacts on other parts of Finland. Labour migration from abroad can support productivity growth by facilitating the expansion the labour markets around the largest cities without necessarily causing population decline in other areas. In any case, population growth in Finland now relies entirely on immigration.
Improvements in transportation infrastructure can connect firms with a new pool of workers and other firms, thereby increasing the effective size of the local labour market. However, it is unlikely that investments in interregional transportation infrastructure have large productivity effects. Any individual infrastructure project should go through a rigorous cost-benefit analysis. Furthermore, when reforming central government grant systems, more attention should be paid to the locational incentives that grants create for workers and firms and how they are related to productivity.
The Finnish labour market has become less efficient at matching unemployed jobseekers with vacancies. This trend does not appear to be explained by an increase in regional or occupational mismatch between jobseekers and vacancies.
Moreover, regional and occupational mismatch accounts for only a small share of overall unemployment. As a result, policies aimed at increasing such mobility are unlikely to have a significant impact on reducing unemployment.
Public employment services (PES) have been transferred from the responsibility of central government to the municipalities. This decentralisation as such is not likely to have strong employment effects. However, the reform also includes incentive changes that can strengthen employment. For example, the municipalities cover a growing share of the costs of unemployment benefits paid to their inhabitants and the costs increase when unemployment spells lengthen. This is likely to motivate the municipalities to search for effective policies to improve matching in local labour markets.
Tackling employment obstacles often needs cooperation between the providers of employment and healthcare services. After the reform the municipalities are responsible for employment services and the wellbeing services counties for healthcare services. This division of responsibilities may increase the risks of service shortfalls and cost-shifting efforts that are harmful for those who are most in need of measures supporting working ability. It is important to closely monitor the choices the municipalities and the wellbeing services counties make in this respect.
The municipalities’ larger share of unemployment costs shapes the functioning of local public finances. In the new system the revenues (the compensation from central government) are constant in real terms. The costs vary according to the economic situation since unemployment benefits vary depending on the economic cycle. This kind of asymmetry between the revenue and expenditure side may become harmful and may also affect the ability to finance other municipal services in a predictable way. The functioning of the financing model needs to be evaluated e.g. from this perspective and the compensation mechanism needs to be adjusted if the weak economic situation leads to clear discrepancies between expenditures and revenues earlier than expected.
Adam, Stuart, Tim Besley, Richard Blundell, Stephen Bond, Robert Chote, Malcolm Gammie, Paul Johnson, James Mirrlees, Gareth Myles, and James M. Poterba (2011) Tax by Design: The Mirrlees Review, Oxford: Oxford University Press.
Aho, Simo, Robert Arnkil, Kari Hämäläinen, Sami Lind, Timo Spangar, Juha Tuomala, Satu Ojala, Antti Saloniemi, and Jari Stenvall (2024) “Työllisyyden kuntakokeilujen arviointi,” Valtioneuvoston selvitys- ja tutkimustoiminnan julkaisusarja 2024:3, Prime Minister’s Office.
Ahola, Ilari, Jenni Pääkkönen, and Veliarvo Tamminen (2017) “Finanssipolitiikan päätösperäisyyden arvioiminen – vaihtoehtoisten mittareiden esittely,” Valtiovarainministeriön julkaisuja 40/2017, Ministry of Finance.
Alasalmi, Juho (2022) “Selittävätkö alueellinen ja ammatillinen kohtaanto työmarkkinoiden kohtaannon heikentymistä?” Työpoliittinen aikakauskirja, 65 (4/2022), 22–30.
Arnkil, Robert, Timo Spangar, Esa Jokinen, Matti Tuusa, and Sari Pitkänen (2015) “Kokonaisvoimavarat käyttöön työllisyyden edistämisessä : Työllisyyden kuntakokeilun (2012–2015) seurantatutkimuksen loppuraportti,” Työ- ja elinkeinoministeriön julkaisuja 47/2015, Ministry of Economic Affairs and Employment.
Bank of Finland (2024) “Suomen talouden ennuste, joulukuu 2024,” Euro & talous 5/2024, Bank of Finland.
Bratu, Cristina and Teemu Lyytikäinen (2024) “The urban wage premium in Finland,” Memorandum 2/2024, Finnish Economic Policy Council.
Correia, Isabel (2010) “Consumption Taxes and Redistribution,” American Economic Review, 100 (4), 1673–94, 10.1257/aer.100.4.1673.
Dauth, Wolfgang, Sebastian Findeisen, Enrico Moretti, and Jens Suedekum (2022) “Matching in cities,” Journal of the European Economic Association, 20 (4), 1478–1521, 10.1093/jeea/jvac004.
Eeckhout, Jan and Ilse Lindenlaub (2019) “Unemployment Cycles,” American Economic Journal: Macroeconomics, 11 (4), 175–234, 10.1257/ mac.20180105.
Einiö, Elias, Marita Laukkanen, and Marika Viertola (2024) “Lausunto luonnoksesta hallituksen esitykseksi eduskunnalle laiksi eräiden suurten ilmastoneutraaliin talouteen tähtäävien investointien verohyvityksestä,” lausunto eduskunnan valtiovarainvaliokunnalle, Valtion taloudellinen tutkimuskeskus (VATT).
Eliasson, Kent and Olle Westerlund (2023) “The urban wage premium and spatial sorting on observed and unobserved ability,” Journal of Economic Geography, 23 (3), 601–627, 10.1093/jeg/lbac029.
EPC (2024) “Economic Policy Council Report 2023,” Finnish Economic Policy Council.
European Commission (2024) “Debt sustainability monitor 2023,” Institutional Paper 271, European Commission.
Finnish Government (2023) “A strong and committed Finland : Programme of Prime Minister Petteri Orpo’s Government 20 June 2023,” Publications of the Finnish Government 2023:60, Finnish Government.
Gäddnäs, Niklas and Henri Keränen (2023) “Beveridgean unemployment gap in Finland,” Background report, Finnish Economic Policy Council.
Glaeser, Edward L and David C Maré (2001) “Cities and skills,” Journal of Labor Economics, 19 (2), 316–342, 10.1086/319563.
Haapamäki, Taina, Oskari Harjunen, Antti Kauhanen, Veeti Kuivalainen, Krista Riukula, Nelli Valmari, and Touko Väänänen (2024) “Kasautumisen vaikutus tuottavuuteen: Työpaikkojen välisen aavutettavuuden vaikutus toimipaikkoihin ja työntekijöihin,” ETLA Raportti 144, ETLA Economic Research.
Holster, Tuukka, Taru Haula, and Korajoki Merja (2022) “Sote-rahoituksen tarvevakiointi: Päivitys 2022,” Työpaperi 26/2022, The Finnish Institute for Health and Welfare (THL).
Honkatukia, Juha (2020) “SOME-mallin arvio sosiaalipalveluiden ja terveydenhoidon kustannuksista,” memorandum, The Finnish Institute for Health and Welfare (THL).
Honkatukia, Juha and Matti Pihlava (2024) “Sote-rahoituksen palvelutarpeen muutoksen arviointi SOME-mallilla,” memorandum, The Finnish Institute for Health and Welfare (THL).
Hsieh, Chang-Tai and Enrico Moretti (2019) “Housing constraints and spatial misallocation,” American Economic Journal: Macroeconomics, 11 (2), 1–39, 10.1257/mac.20170388.
Häkkinen, Unto, Tuukka Holster, Taru Haula, Satu Kapiainen, Petra Kokko, Merja Korajoki, Suvi Mäklin, Lien Nguyen, Tuuli Puroharju, and Mikko Peltola (2020) “Sote-rahoituksen tarvevakiointi,” Raportti 6/2020, The Finnish Institute for Health and Welfare (THL).
Hämäläinen, Kari and Juha Tuomala (2024) “Uusille urille vai takaisin juurille - näkökulmia työttömien palveluiden siirtoon kunnille,” Kansantaloudellinen aikakauskirja, 120 (4), 398–412.
Kujanpää, Lauri, Kati Koponen, Onni Linjala, Sampo Mäkikouri, and Antti Arasto (2023) “Teknologisten hiilinielujen mahdollisuudet ja niiden edistäminen Suomessa,” Suomen ilmastopaneelin raportti 5/2023, The Finnish Climate Change Panel.
Lyytikäinen, Teemu, Sander Ramboer, and Max Toikka (2024) “Fiscal transfers to local governments and the distribution of economic activity,” VATT Working Papers 171, VATT Institute for Economic Research.
Marinescu, Ioana and Roland Rathelot (2018) “Mismatch Unemployment and the Geography of Job Search,” American Economic Journal: Macroeconomics, 10 (3), 42–70, 10.1257/mac.20160312.
Ministry of Finance (2022) “Economic Survey : Autumn 2022,” Publications of the Ministry of Finance 2022:60, Ministry of Finance.
_________ (2023a) “General Government Fiscal Plan for 2024-2027,” Publications of the Ministry of Finance 2023:69, Ministry of Finance.
_________ (2023b) “General Government Fiscal Plan for 2024-2027,” Publications of the Ministry of Finance 2023:28, Ministry of Finance.
_________ (2024a) “Economic Survey : Autumn 2024,” Publications of the Ministry of Finance 2024:45, Ministry of Finance.
_________ (2024b) “Economic Survey : Winter 2024,” Publications of the Ministry of Finance 2024:69, Ministry of Finance.
_________ (2024c) “Finland’s Medium-Term Plan 2025–2028 : National Medium-Term Fiscal-Structural Plan,” Publications of the Ministry of Finance 2024:59, Ministry of Finance.
_________ (2024d) “General Government Fiscal Plan for 2025-2028,” Publications of the Ministry of Finance 2024:34, Ministry of Finance.
National Audit Office of Finland (2024) “Valtiontalouden tarkastusviraston erilliskertomus eduskunnalle: Finanssipolitiikan valvonnan raportti 2024,” Valtiontalouden tarkastusviraston eduskunnalle annettavat kertomukset K 22/2024 vp, National Audit Office of Finland.
Nieminen, Jeremias, Ohto Kanninen, and Hannu Karhunen (2023) “The decentralization of public employment services and local governments’ responses to incentives,” Journal of Economic Geography, 23 (6), 1371–1395, 10.1093/jeg/lbad027.
Riihelä, Marja and Matti Tuomala (2022) “Verotuksen rooli tulo- ja varallisuuserojen taustalla,” in Rajavuori, Anna ed. Eriarvoisuuden tila Suomessa 2022: Kalevi Sorsa Foundation.
De la Roca, Jorge and Diego Puga (2017) “Learning by working in big cities,” The Review of Economic Studies, 84 (1), 106–142, 10.1093/restud/ rdw031.
Rybarczyk, Adam (2023) “Revisions of output gap and potential output in Finland,” Memorandum 1/2023, Finnish Economic Policy Council.
Saarimaa, Tuukka, Heikki Pursiainen, Janne Tukiainen et al. (2015) “Hyvän valtionosuusjärjestelmän periaatteet,” VATT Analyysi 70, VATT Institute for Economic Research.
Uusitalo, Veikko, Merja Kauhanen, Annika Nivala, and Tuomo Suhonen (2024) “Geographical and Occupational Mismatch in Finland over the Recent Era of Economic Crises: Estimates Using an Interconnected-Markets Approach,” Memorandum 1/2024, Finnish Economic Policy Council.